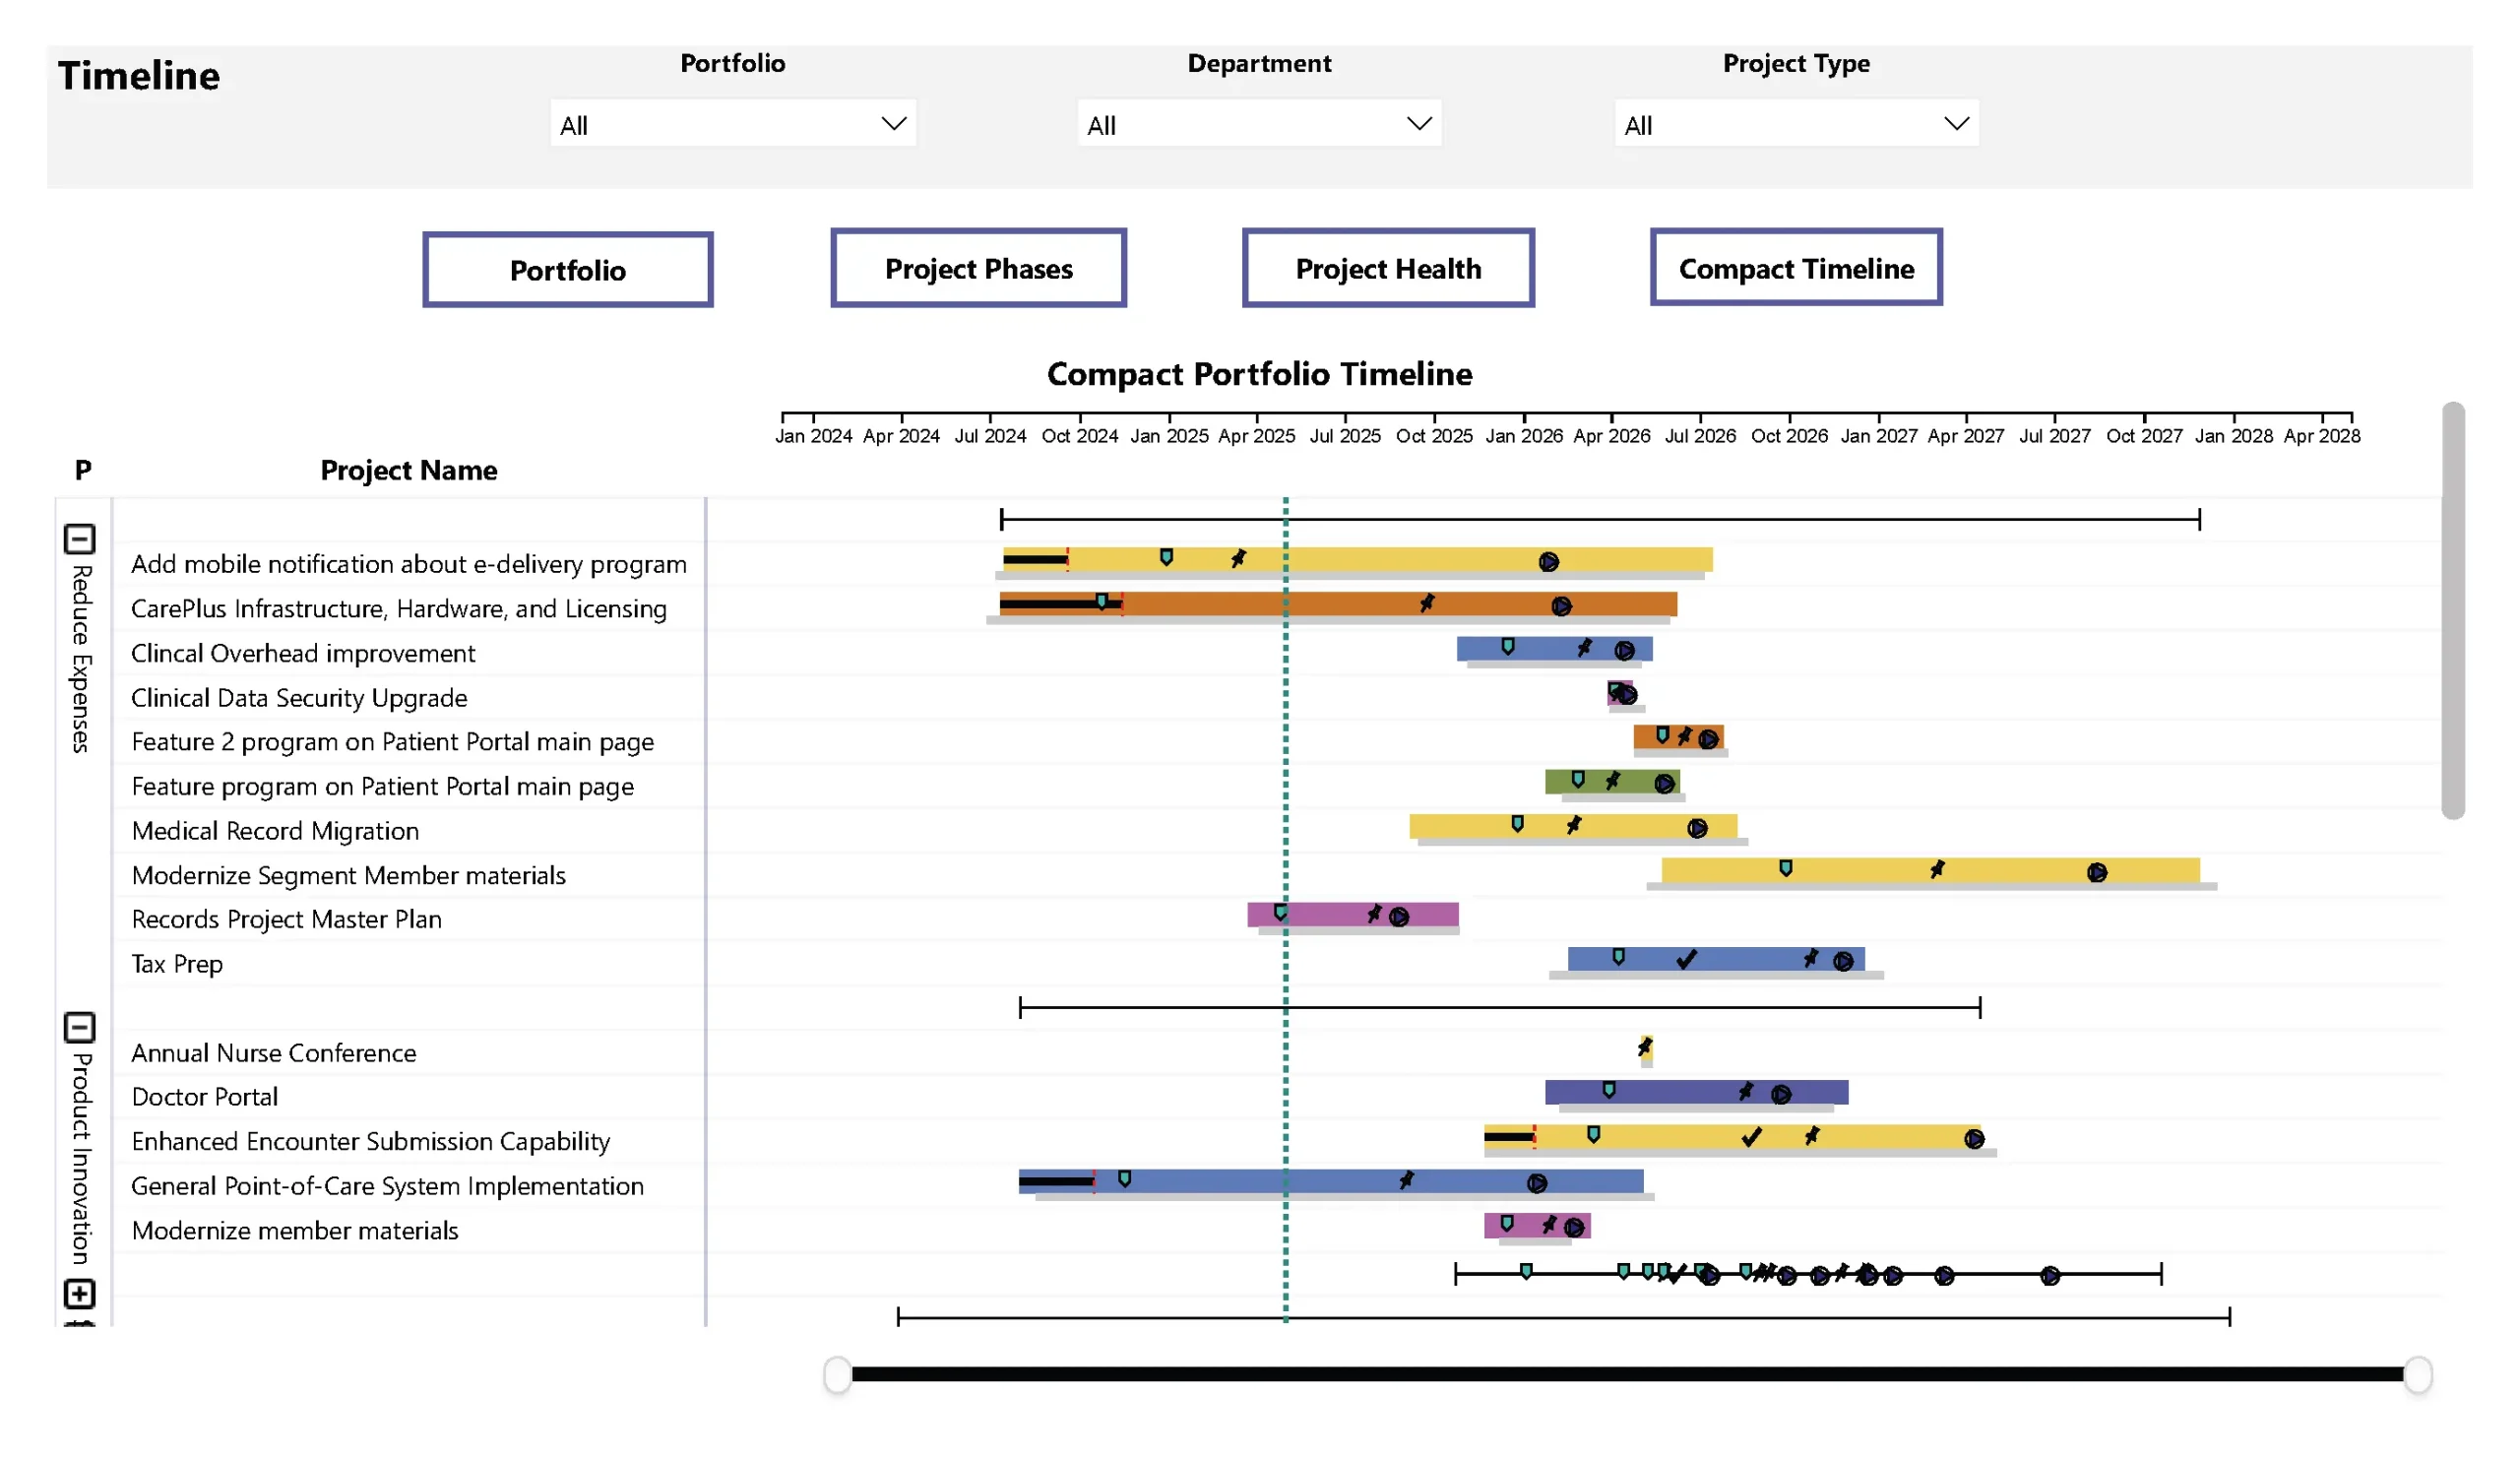
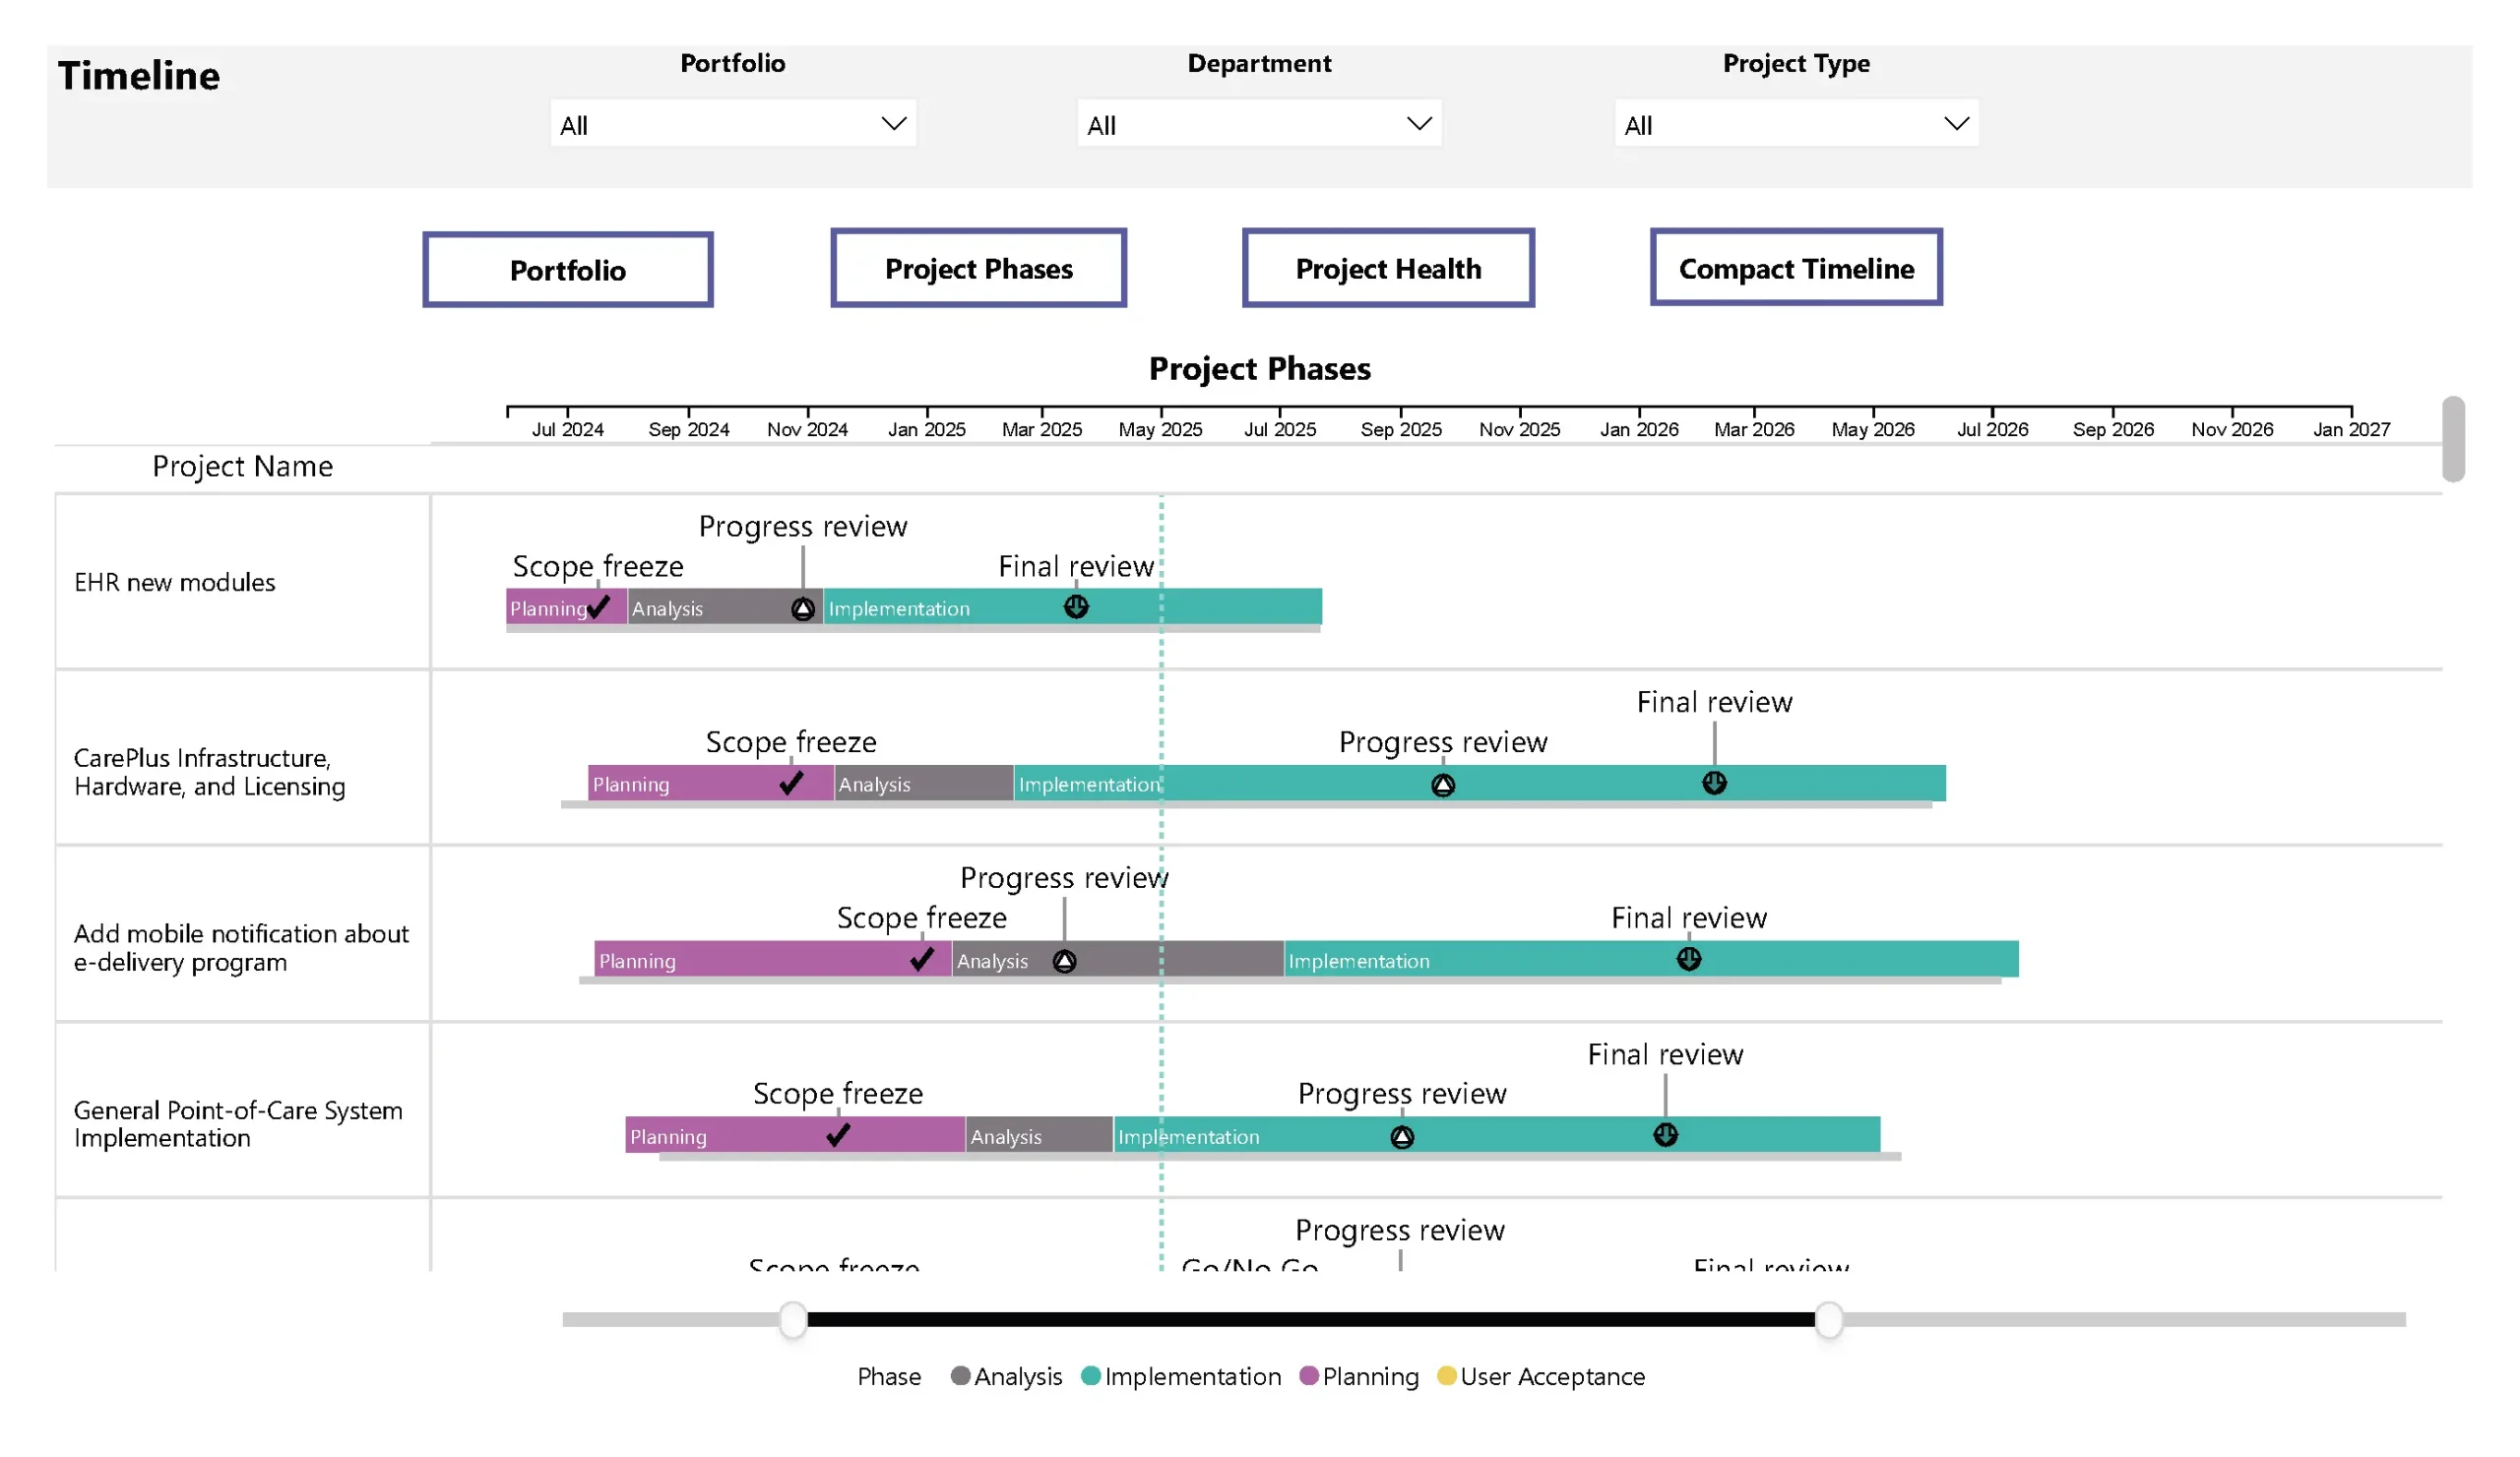
The PowerGraph Gantt Timeline is a premier custom visual for Power BI, engineered to transform your project data into clear, dynamic, and interactive Gantt charts. It empowers project managers and teams by providing an unparalleled view of project schedules, progress, and dependencies, facilitating better planning and execution.
Seamlessly integrated with Power BI, the Gantt Timeline allows you to visualize complex project timelines, track milestones and baselines, and communicate progress effectively. This essential tool helps organizations optimize project management, ensure alignment, and drive successful outcomes through insightful data visualization.
Powerful Features to Visualize and Manage Your Projects
Discover the advanced capabilities that make the PowerGraph Gantt Timeline an indispensable tool for comprehensive project visualization and control.
Dynamic & Interactive Timelines
Experience fully interactive Gantt charts with zoom, scroll, drill-down/up, and toggle controls for bars, baselines, milestones, and labels, offering a fluid user experience.
Comprehensive Customization
Tailor every aspect of your timeline, including bar colors (by data field), milestone shapes and colors, progress indicators, data labels with de-cluttering, and unlimited hierarchy levels.
Milestone & Baseline Tracking
Clearly visualize key project milestones and compare actual progress against original baselines to effectively monitor project performance and identify variances.
Explore Our Leading Solutions

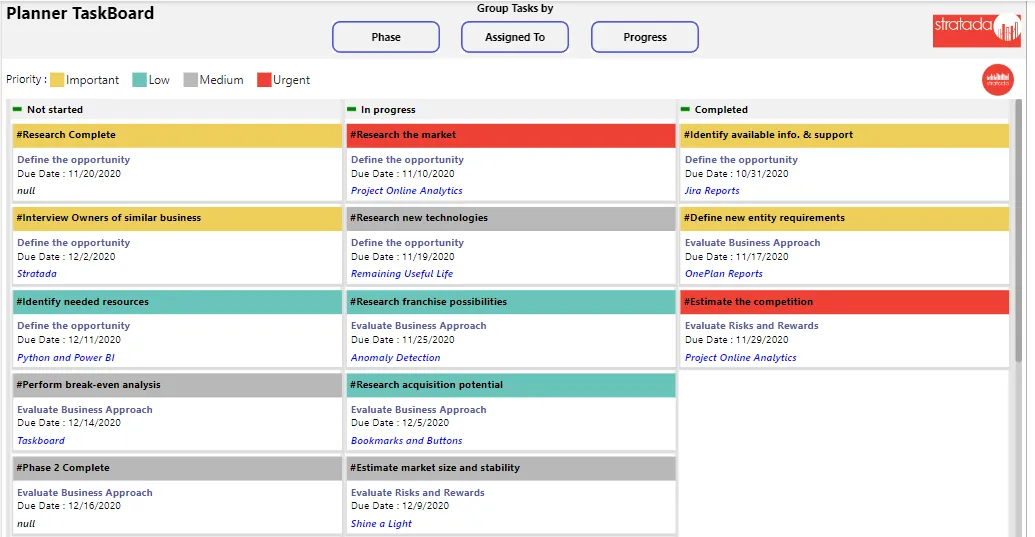
PowerGraph Task Board Visual
Enhance project management with a clear, card-based view of tasks and workflows.
Agile & Kanban Interface
Broad Data Connectivity
Rich Card Customization
Workflow Visualization

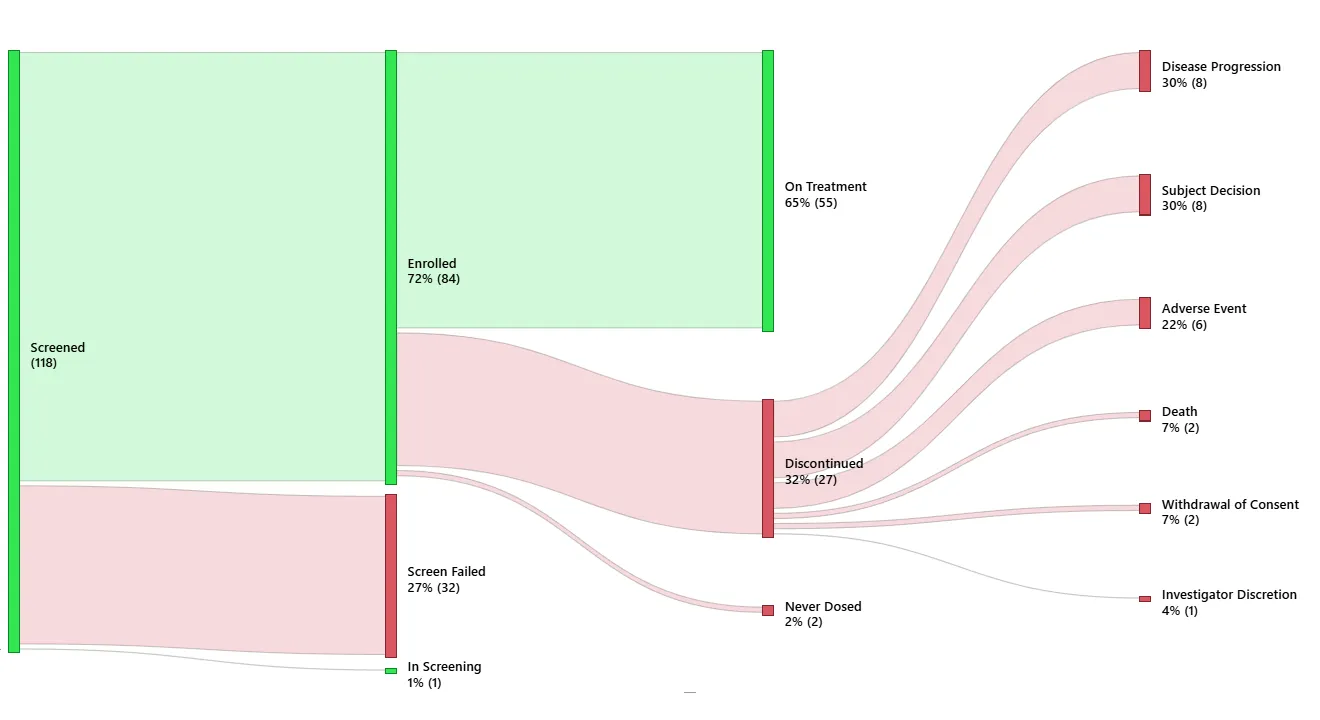
PowerGraph Sankey Visual
Illuminate complex data flows with our enhanced Sankey visual.


