
Empowering Your Data Journey
Transform Your Data Challenges into Strategic Assets
PowerGraph consulting services empower your organization to harness the full potential of your data. We partner with you to move beyond raw data, delivering clear, actionable insights that drive informed decisions and tangible business results.
Data Visualization Mastery
Harness the full potential of your data with our custom visual tools.
Consulting Excellence
Expert guidance to optimize your data strategies and achieve your goals.
Your Partner in Data-Driven Success
At PowerGraph, our mission is to translate complex data landscapes into clear, actionable intelligence. Our deep expertise in the Microsoft Power Platform – particularly Power BI and Power Apps – forms the bedrock of our consulting services. We don't just offer advice; we build tailored solutions, often leveraging our own market-leading custom visuals, to meet your unique challenges. We are committed to innovation and excellence, helping you unlock strategic advantages, enhance operational efficiency, and accelerate growth.
Our Consulting Services

Strategic Data Modeling: The Foundation for Insight
Effective data modeling is crucial for reliable analytics. PowerGraph helps you design and implement robust data models that ensure data integrity, scalability, and performance. We work with you to understand your business processes and reporting requirements, creating a structured data foundation that supports complex queries, facilitates self-service BI, and provides a single source of truth for critical decision-making.

Intuitive Visual Configuration: Clarity from Complexity
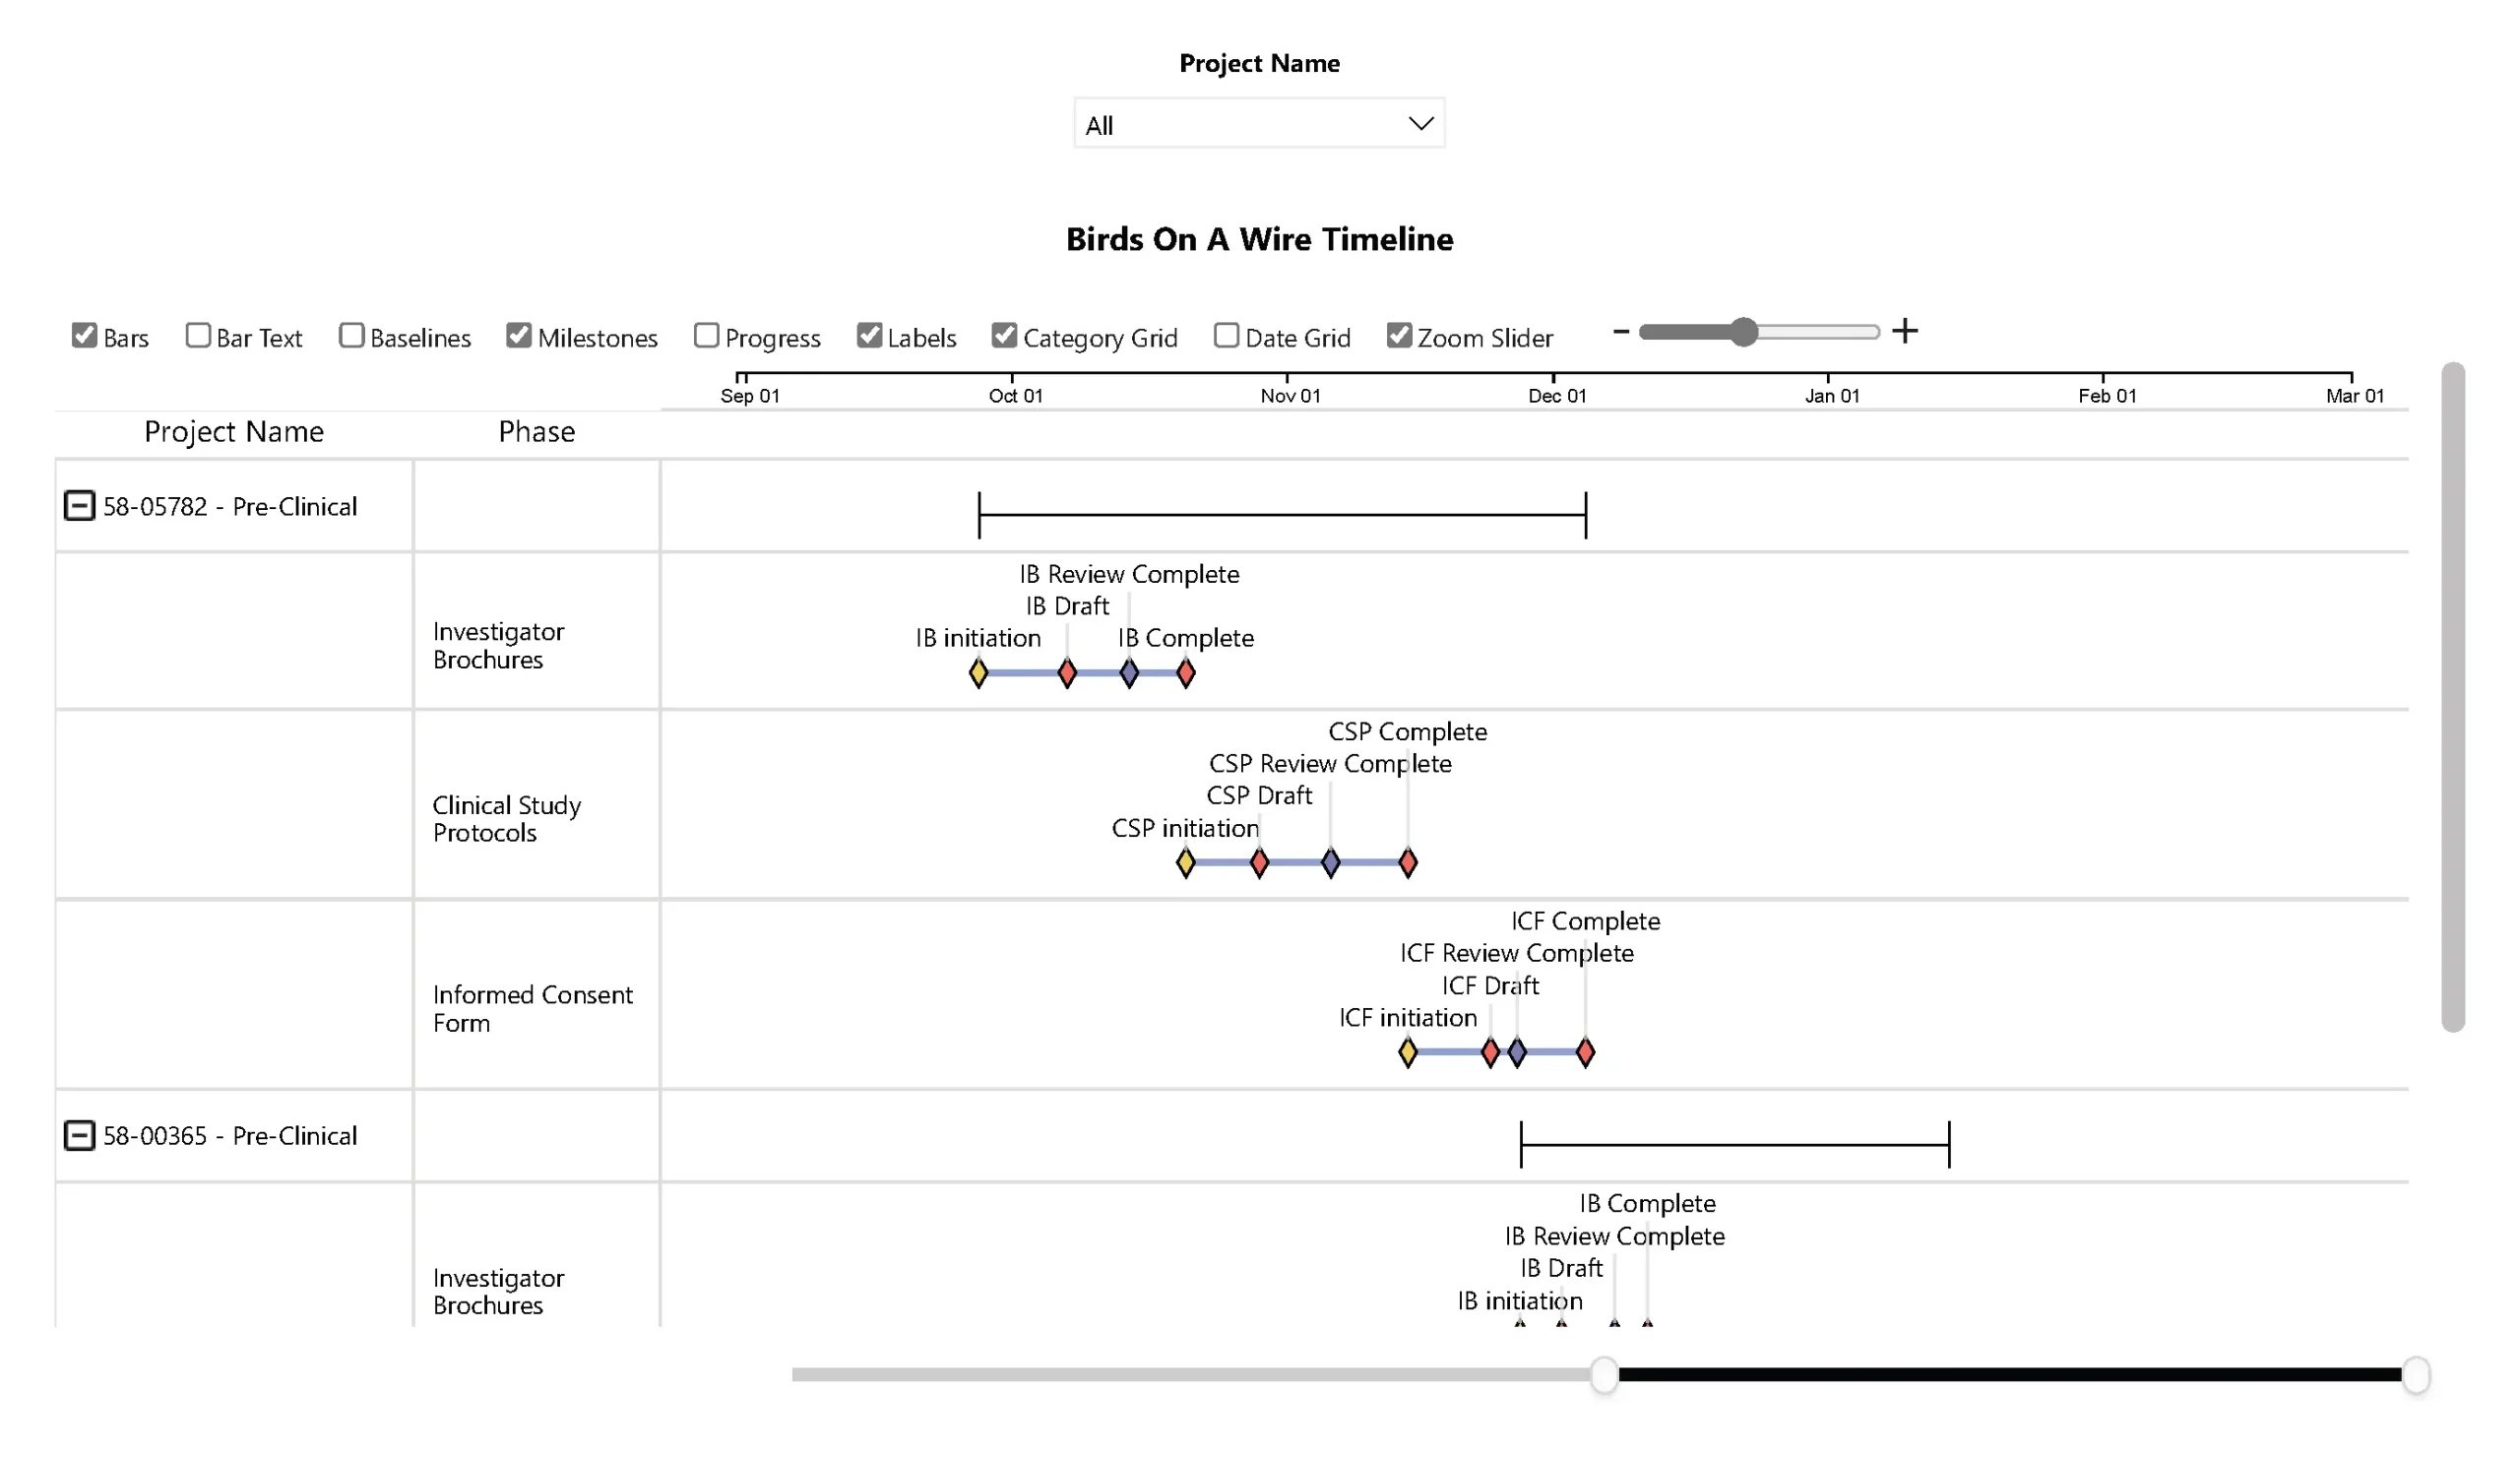
Transforming data into understanding requires more than just charts. PowerGraph specializes in configuring Power BI environments and reports with intuitive, impactful visuals – including our own suite of custom visuals like Gantt, Kanban, and Sankey diagrams. We focus on user experience, ensuring that your dashboards and reports are not only aesthetically pleasing but also highly functional, enabling users to quickly grasp key trends, identify outliers, and drill down into details. Our expertise ensures your data tells a clear and compelling story.
Key Benefits:
- Accelerated data comprehension and insight discovery.
- Increased user adoption of BI tools.
- Tailored visualizations for specific business needs (e.g., clinical trial timelines, site activation progress).
- Empowerment of business users with actionable information.
Impactful Report Design: Driving Strategic Action
PowerGraph designs reports that go beyond simple data presentation. We create comprehensive, insightful reports that directly support your strategic objectives and operational needs. From executive summaries to detailed operational dashboards, we ensure your reports are clear, concise, and focused on the metrics that matter most. Our designs facilitate easy navigation, highlight critical insights, and empower stakeholders to make data-driven decisions with confidence."
- Key Benefits:
- Clear communication of key performance indicators (KPIs).
- Support for strategic planning and operational management.
- Customized reports for different audiences and purposes.
- Enhanced decision-making speed and quality.
Unlock Your Data's Potential
Partner with PowerGraph to transform your data into strategic insights. Our expert consulting services in data modeling, visual configuration, and report design are tailored to meet your business needs. Reach out today and let us help you achieve data-driven success.