
Empowering data with custom visuals and apps
Custom visuals for Power BI and apps for the Power Platform that help your team see, plan and act on its data.
Our visuals are licensed through Microsoft Marketplace.
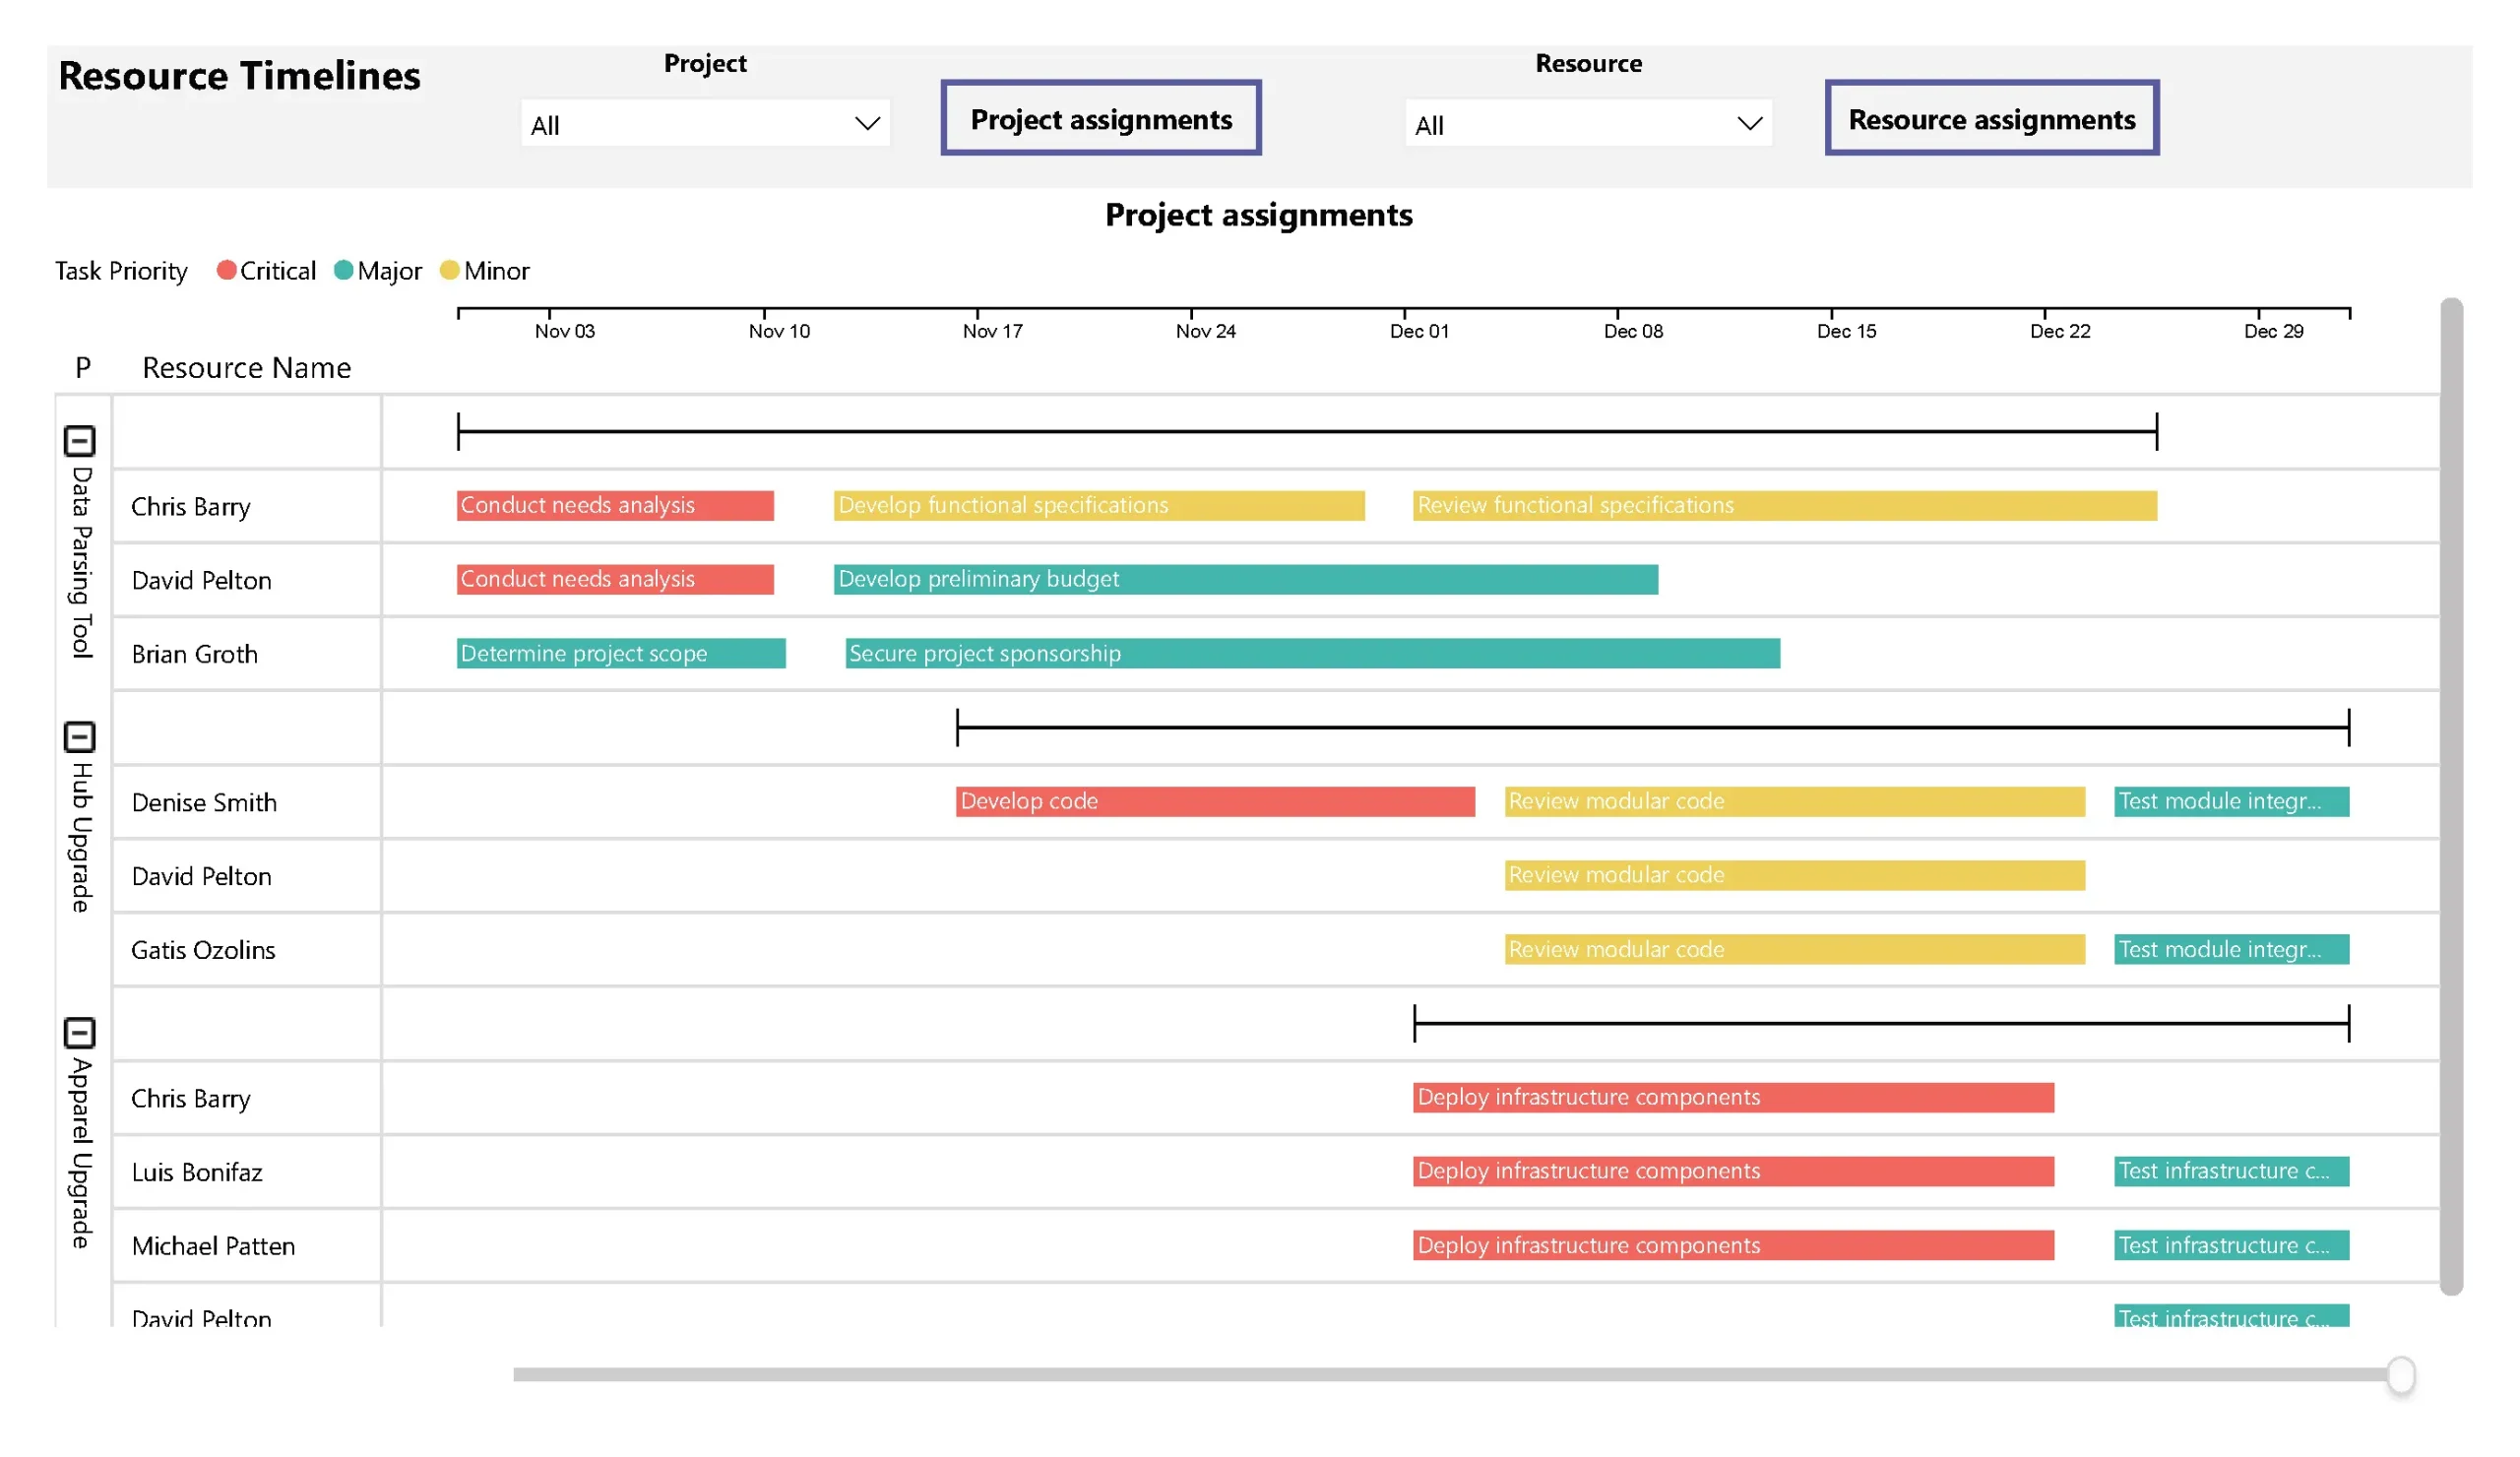
Visuals tailored for Power BI
Each visual is built for intuitive data interaction, so your team can visualize and analyze data with ease.
-
Power BI visual
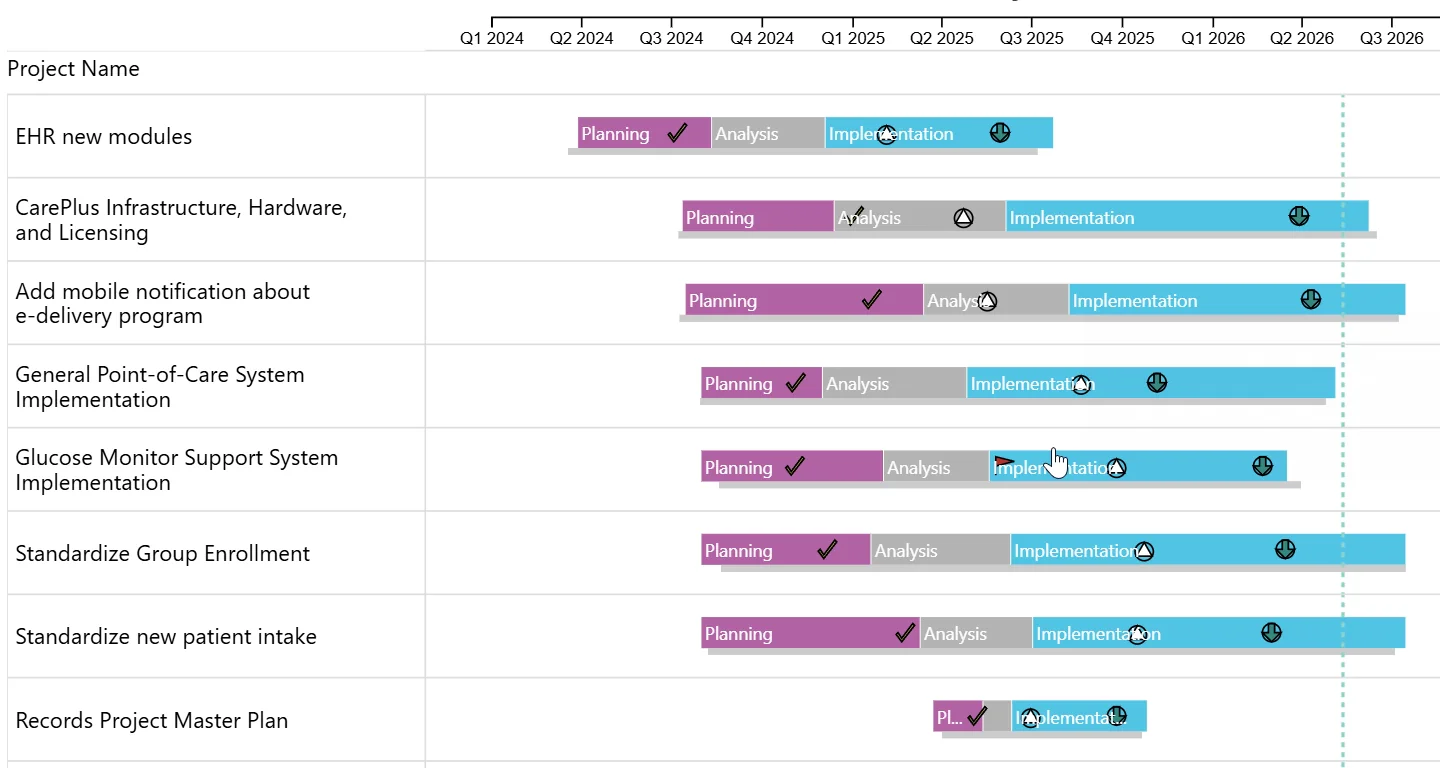
Gantt Timeline
Interactive project timelines with milestones, baselines and resource views.
-
Power BI visual
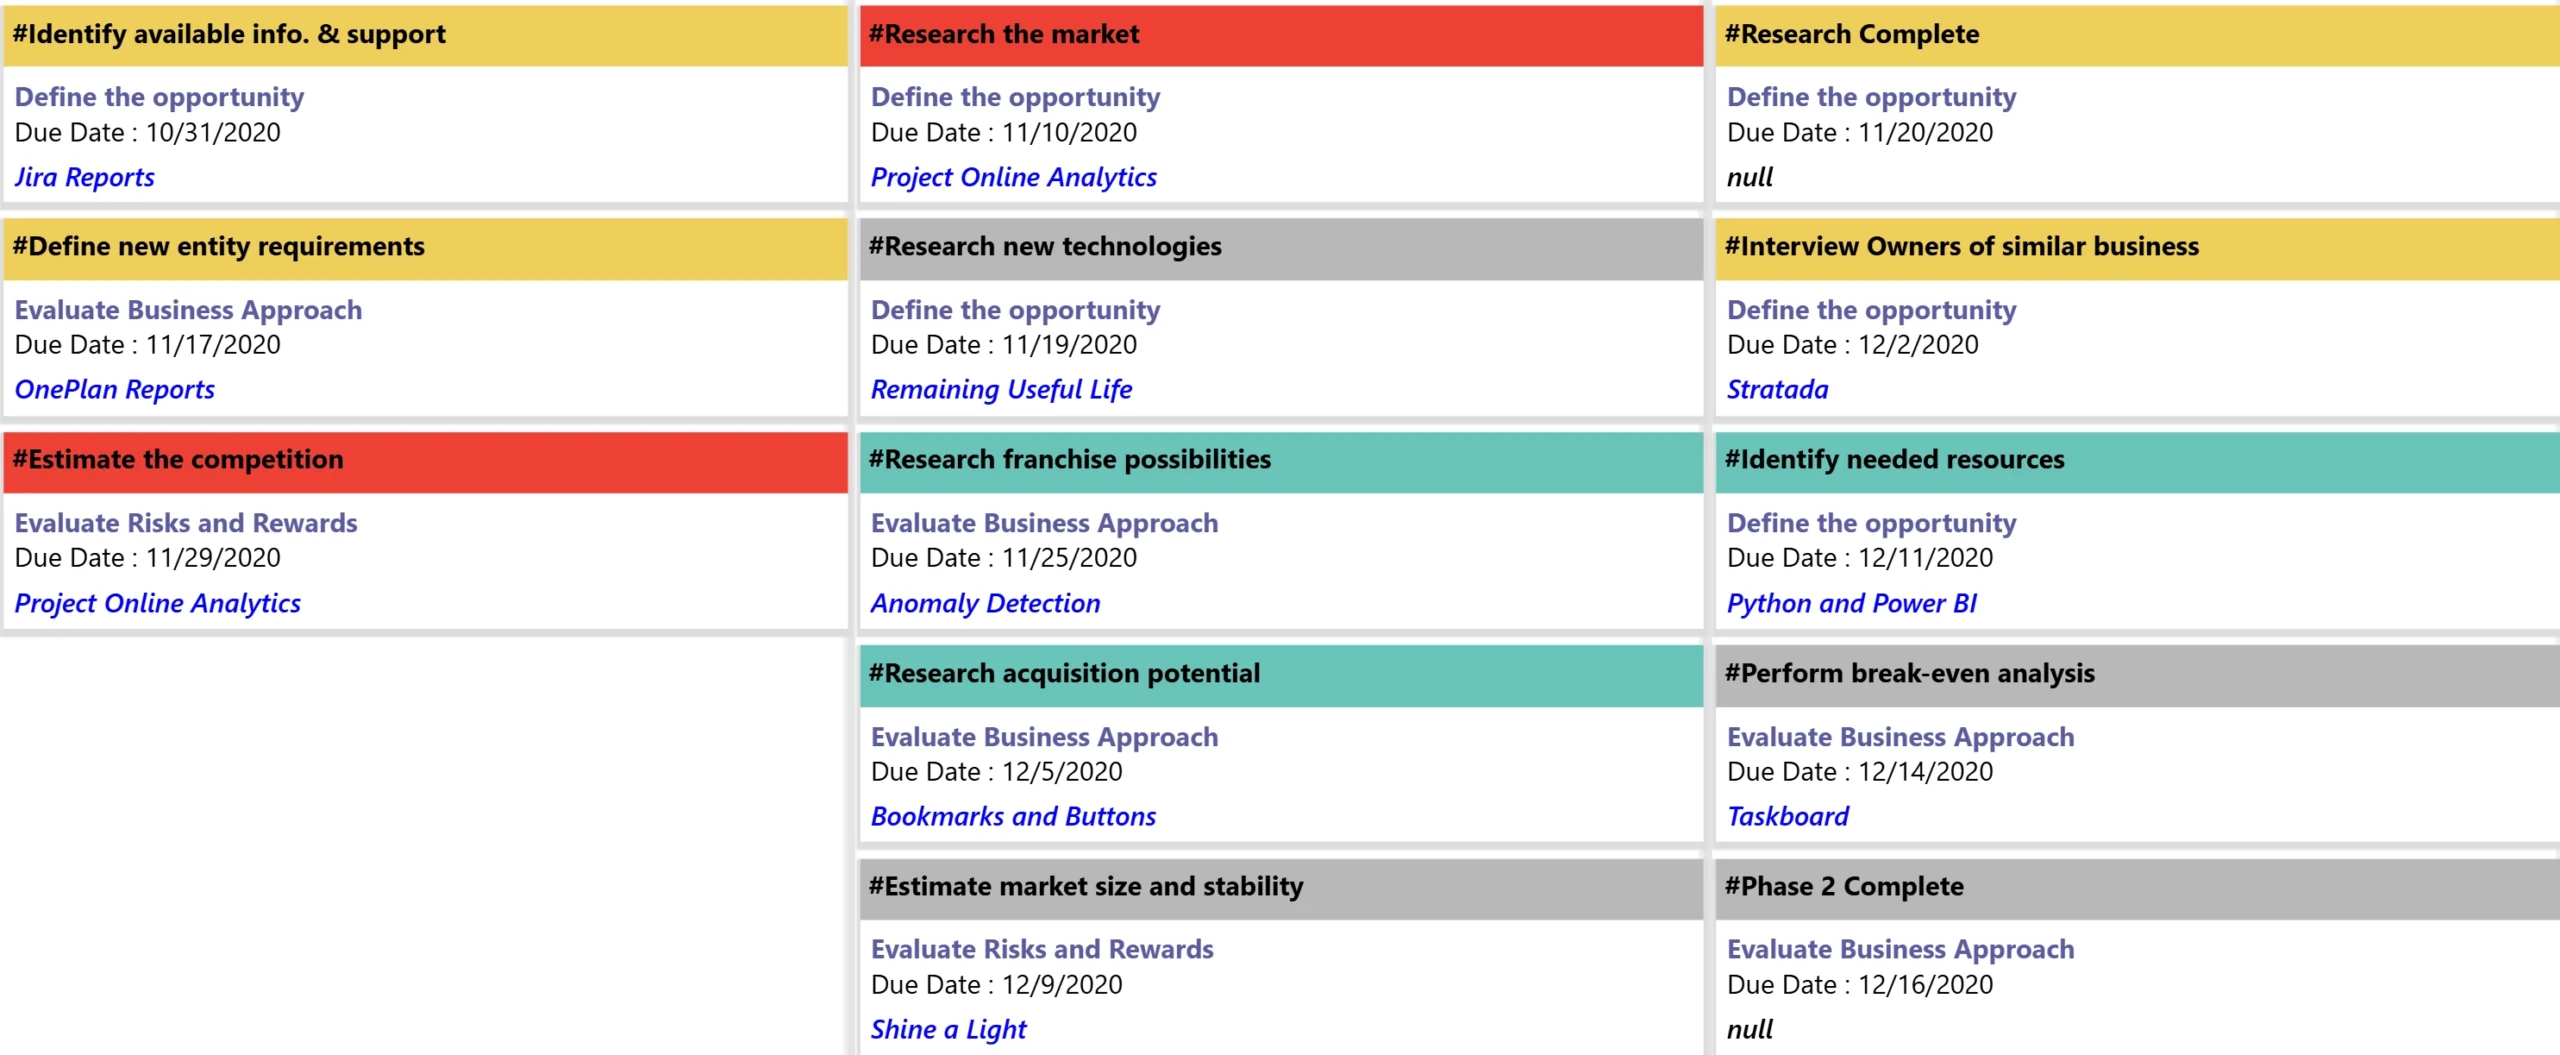
Task Board
A Kanban-style board of tasks and work items that streamlines team workflows.
-
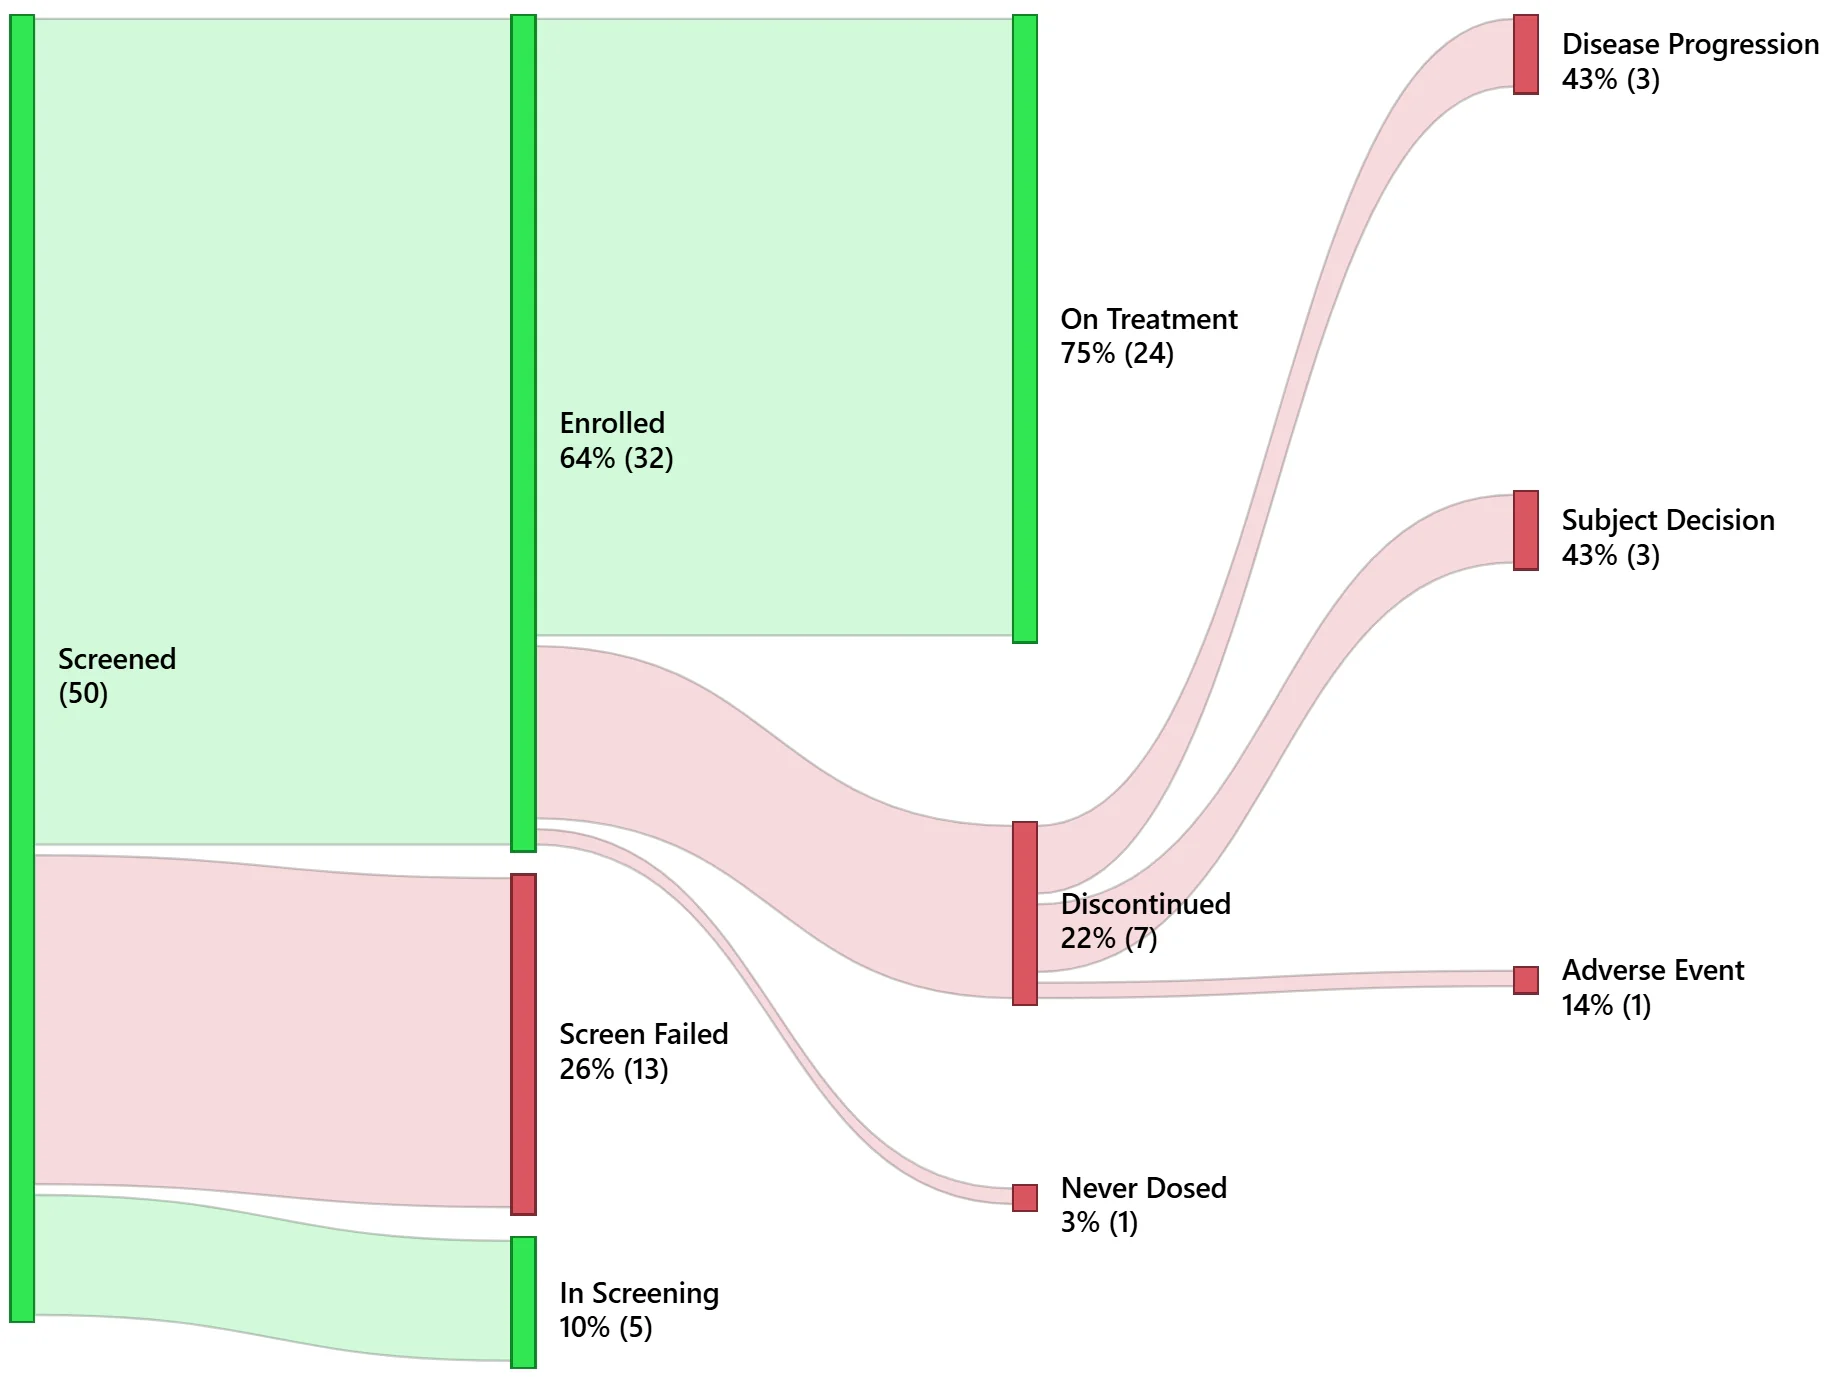
Beyond the visuals
-
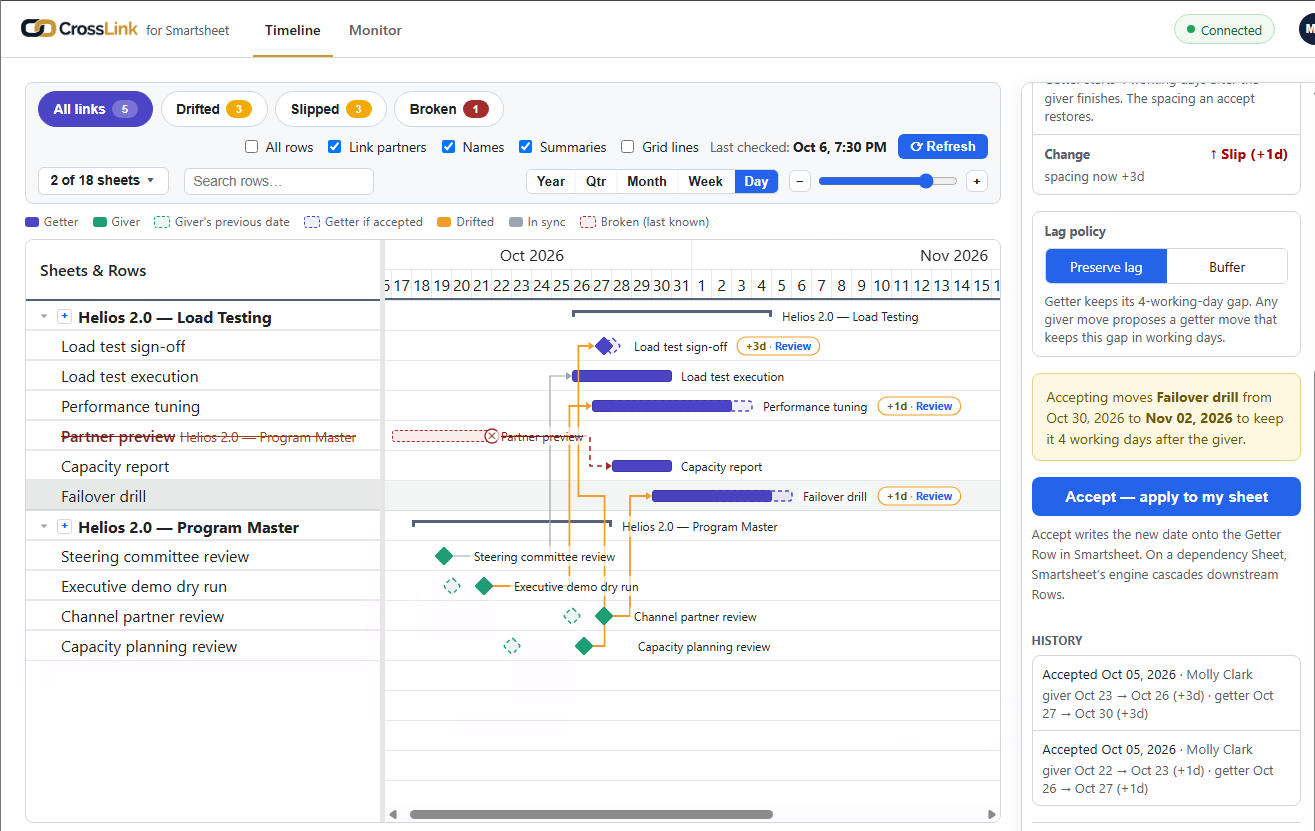
App
CrossLink
Cross-project dependencies, under control, for Microsoft Planner Premium and Smartsheet.
-
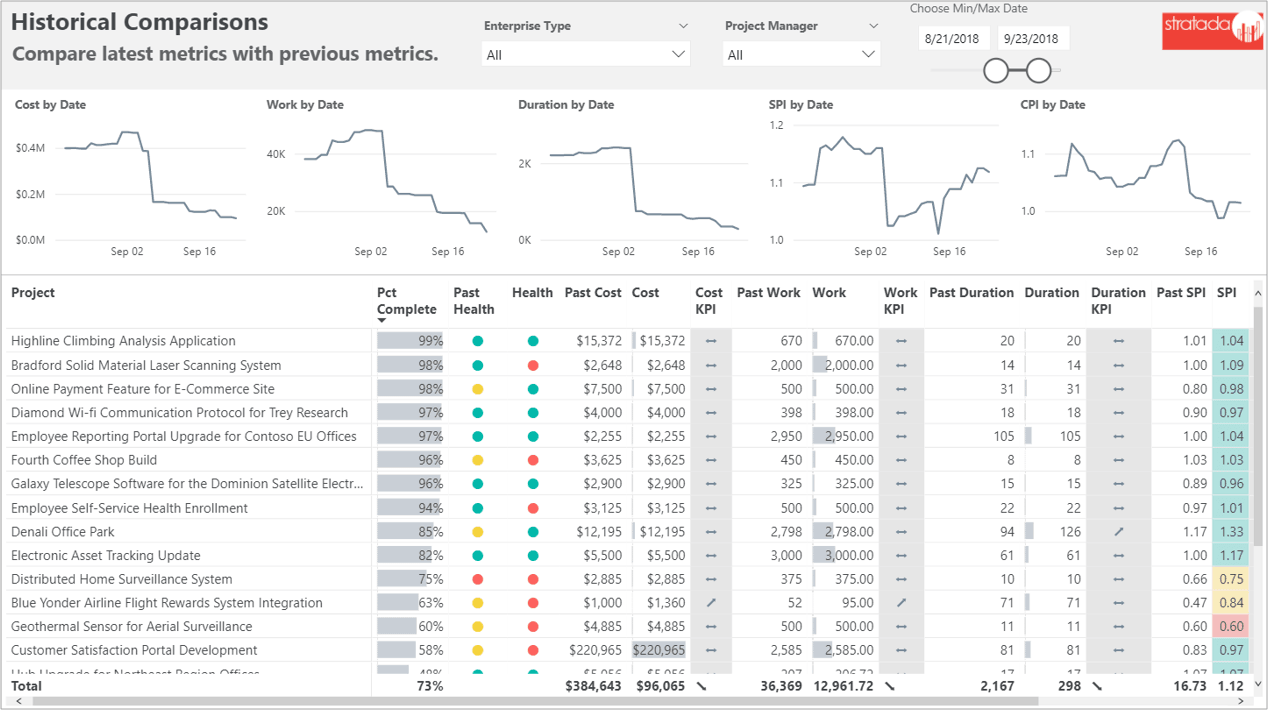
Solution
Time Intelligence
Visualize the history of your critical business data, so updates never overwrite the trend.
-
-
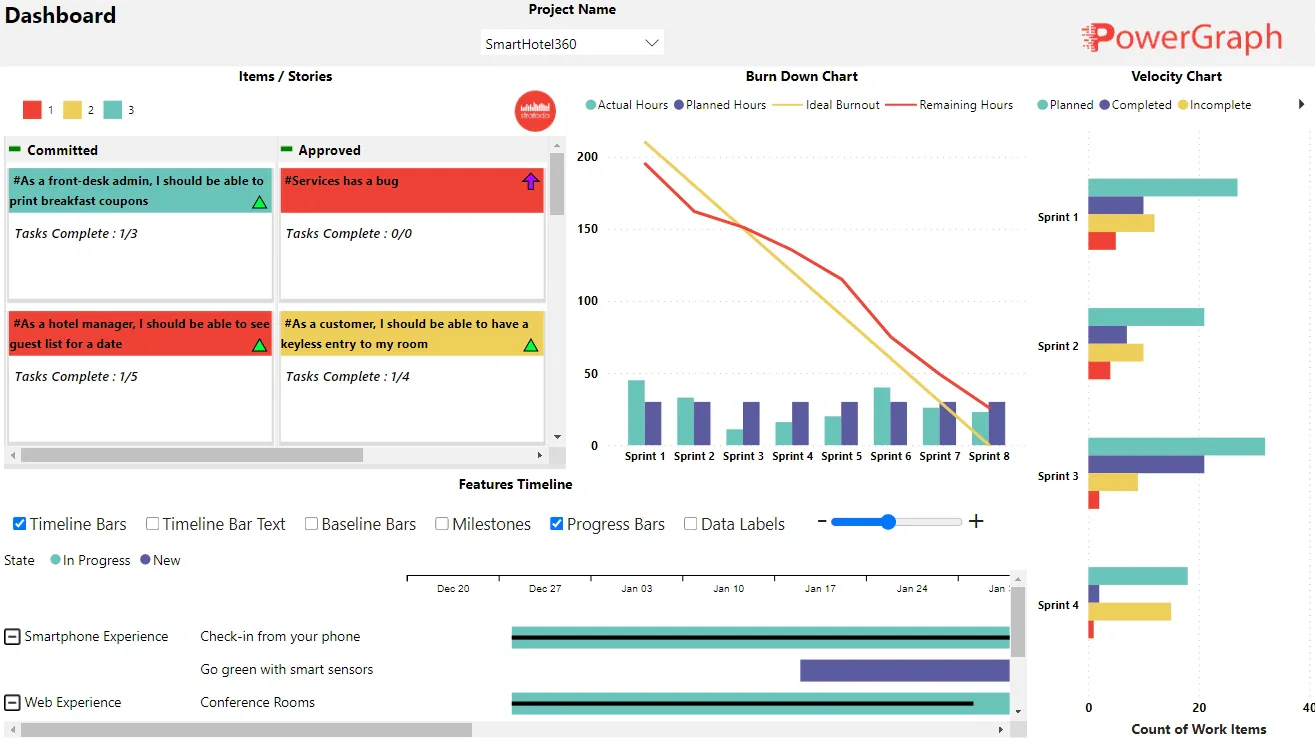
Report packs
Power BI Report Packs
Ready-made Power BI reports for OnePlan, Azure DevOps, Dynamics Project Operations, Jira and Smartsheet.
We'll help you get the most from them
Data modeling
Structure your data efficiently for strong performance and insight.
Report design
Intuitive reports that turn complex data into clear, actionable insight.
Visual configuration
Set up your Power BI visuals to fit your business and tell your data's story.
Not sure which product fits?
Book a consultation and we'll help you choose and set up the right tools for your data.