
Smartsheet report pack for Power BI
Many companies use Smartsheet as it provides simple collaboration for many different needs including work management.
Smartsheet report pack Overview
The reports below are based on sample plans from Smartsheet: Agile Project with Gantt, Bug Tracker Board, KPI Business Dashboard, New Product Development, Project Management Dashboard, Sales Pipeline Overview and Strategic Plan Dashboard
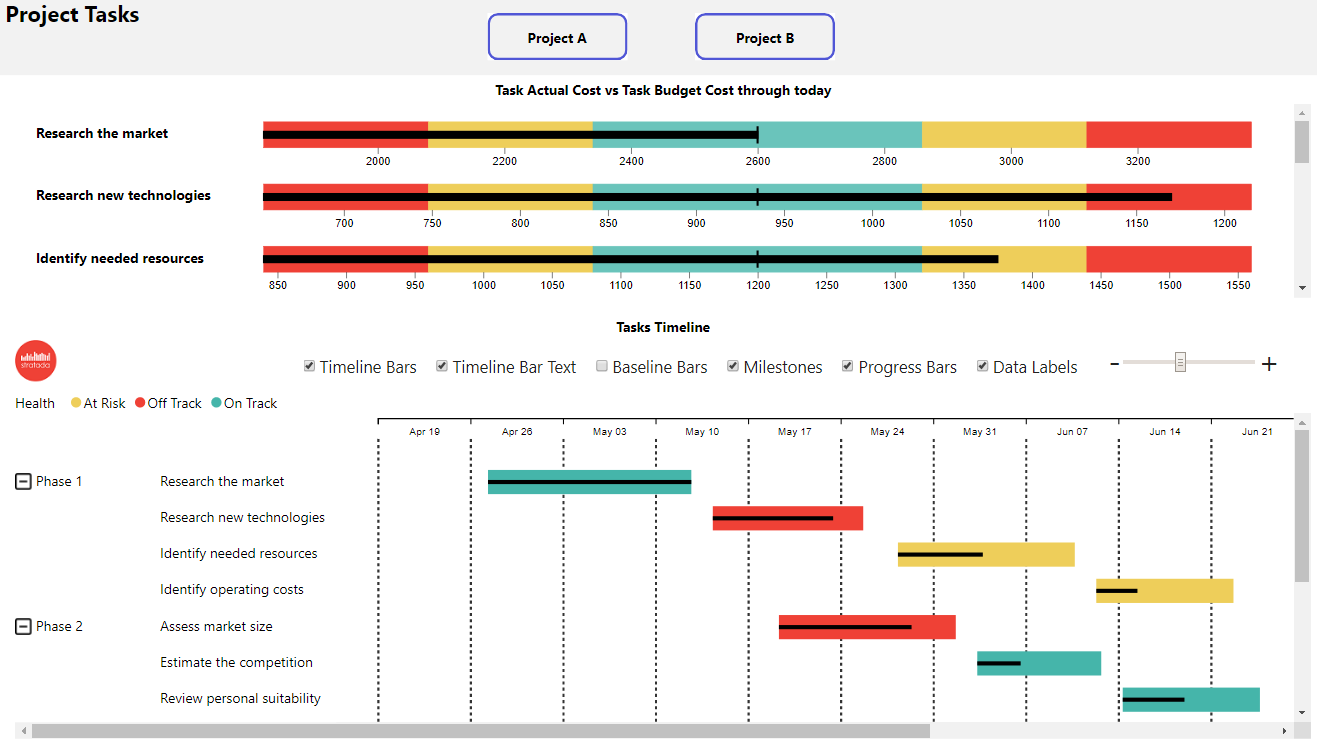
Smartsheet Project Tasks report
The Project Tasks report uses a bullet spectrum chart to show actual cost vs budget with defined red, yellow and green target zones for both overspend and underspend. The PowerGraph Gantt Timeline visual is used to display timing of the tasks along with task health.
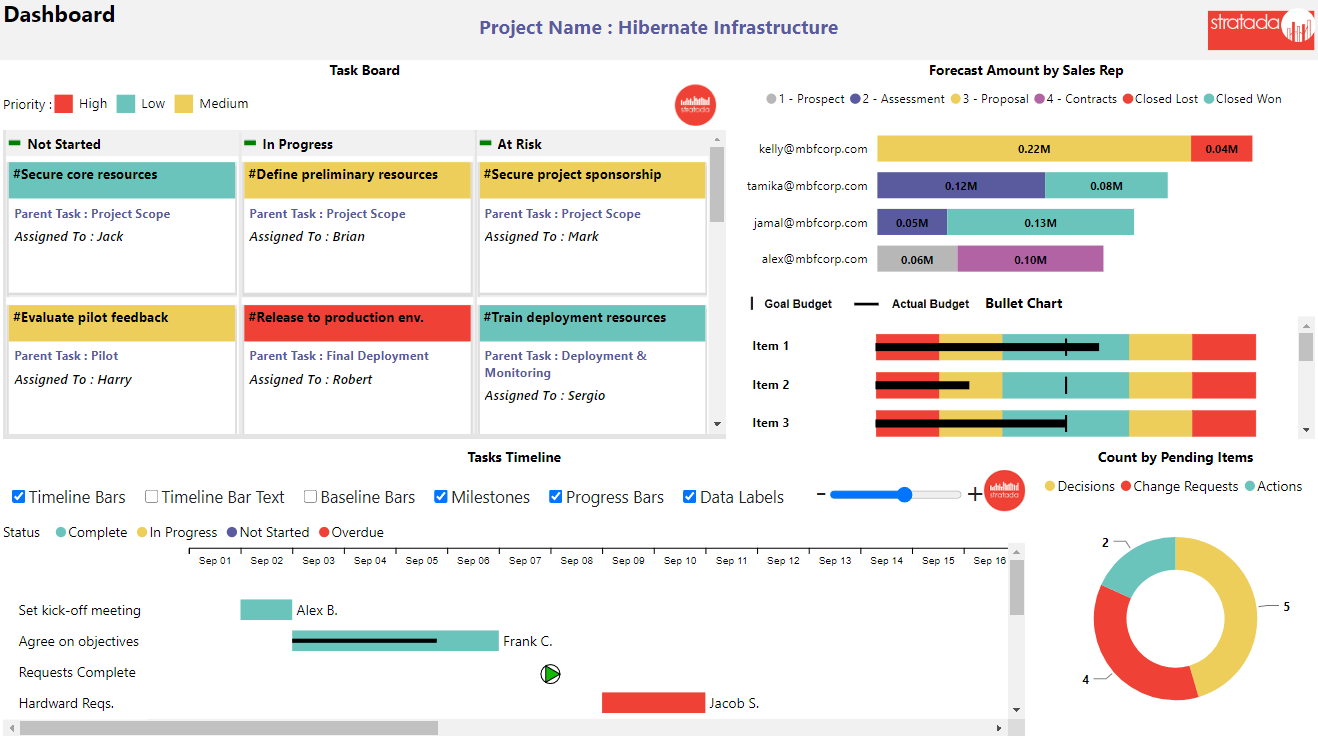
Smartsheet Dashboard
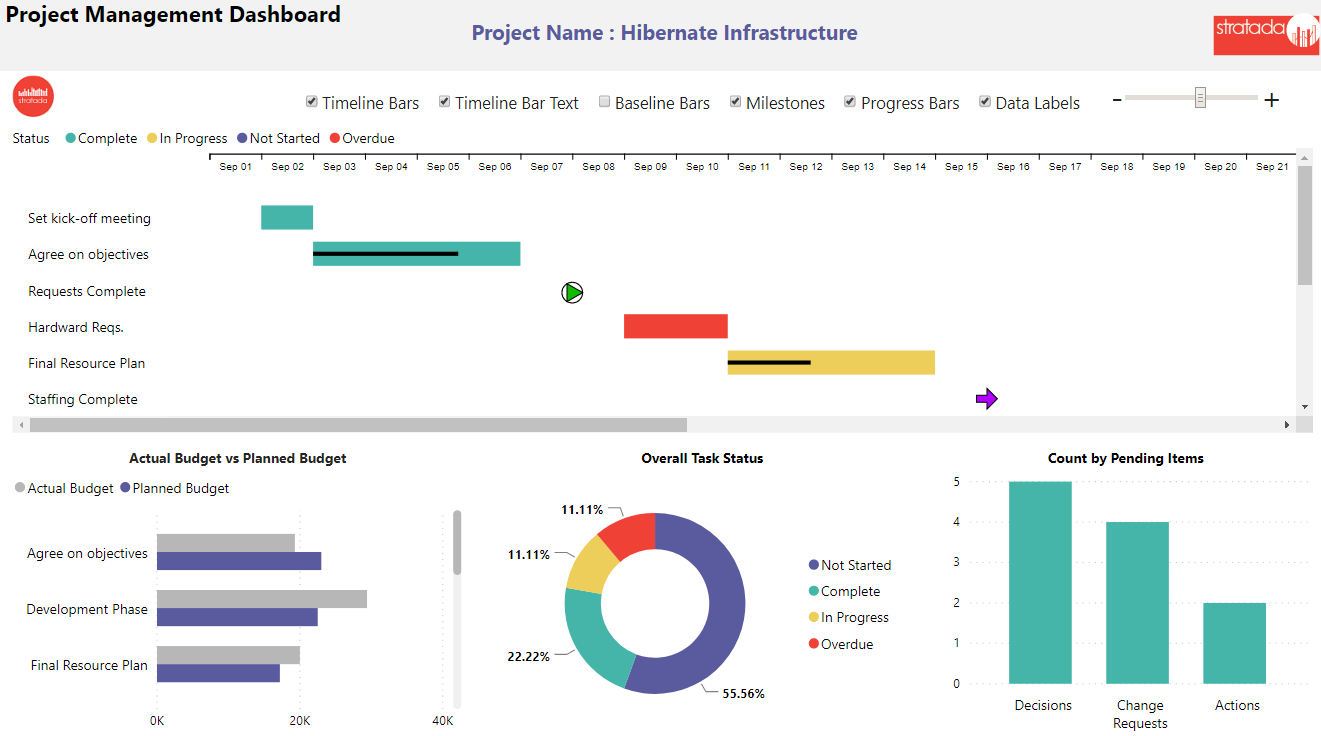
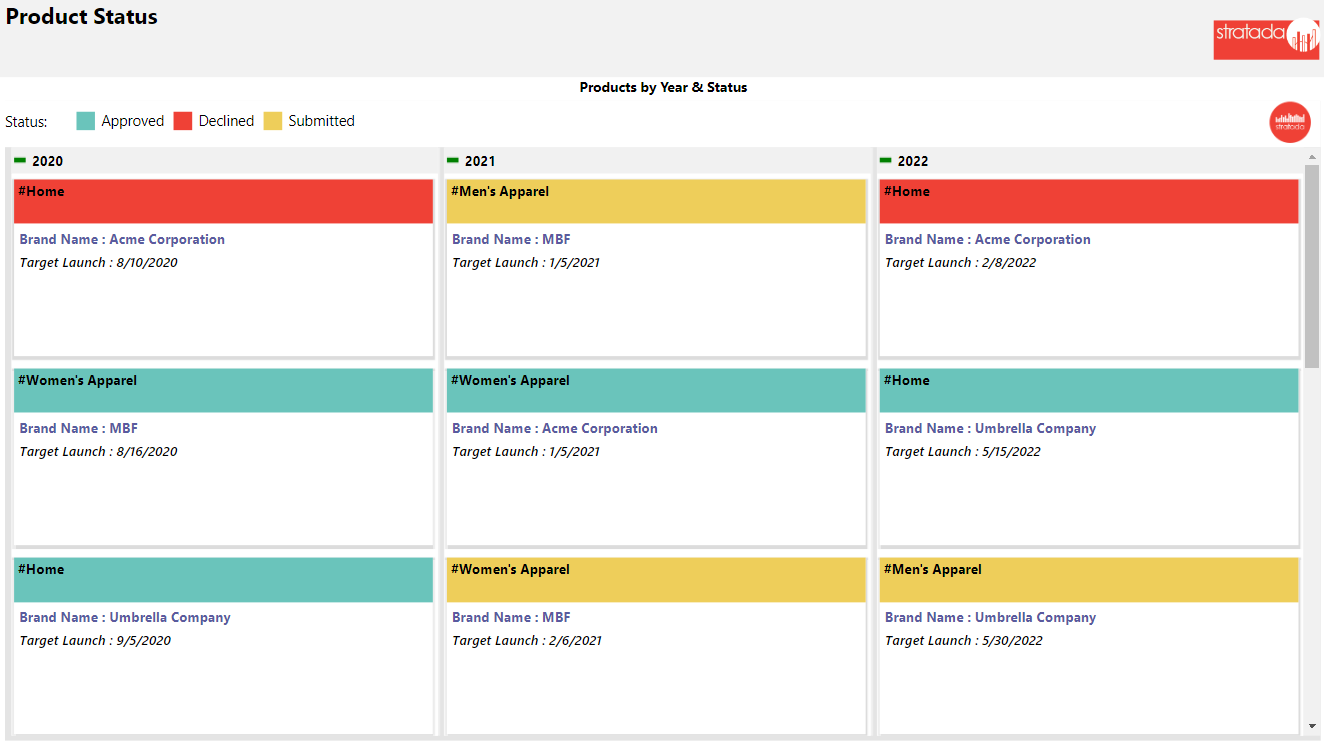
The PowerGraph dashboard for Smartsheet shows how multiple Power BI visuals work together to tell a story. The PowerGraph Gantt Timeline and Task Board visuals are combined visuals showing sales stage and budget to actual data, as well as a donut chart calling out pending items. Drill through from visual elements to see more details.
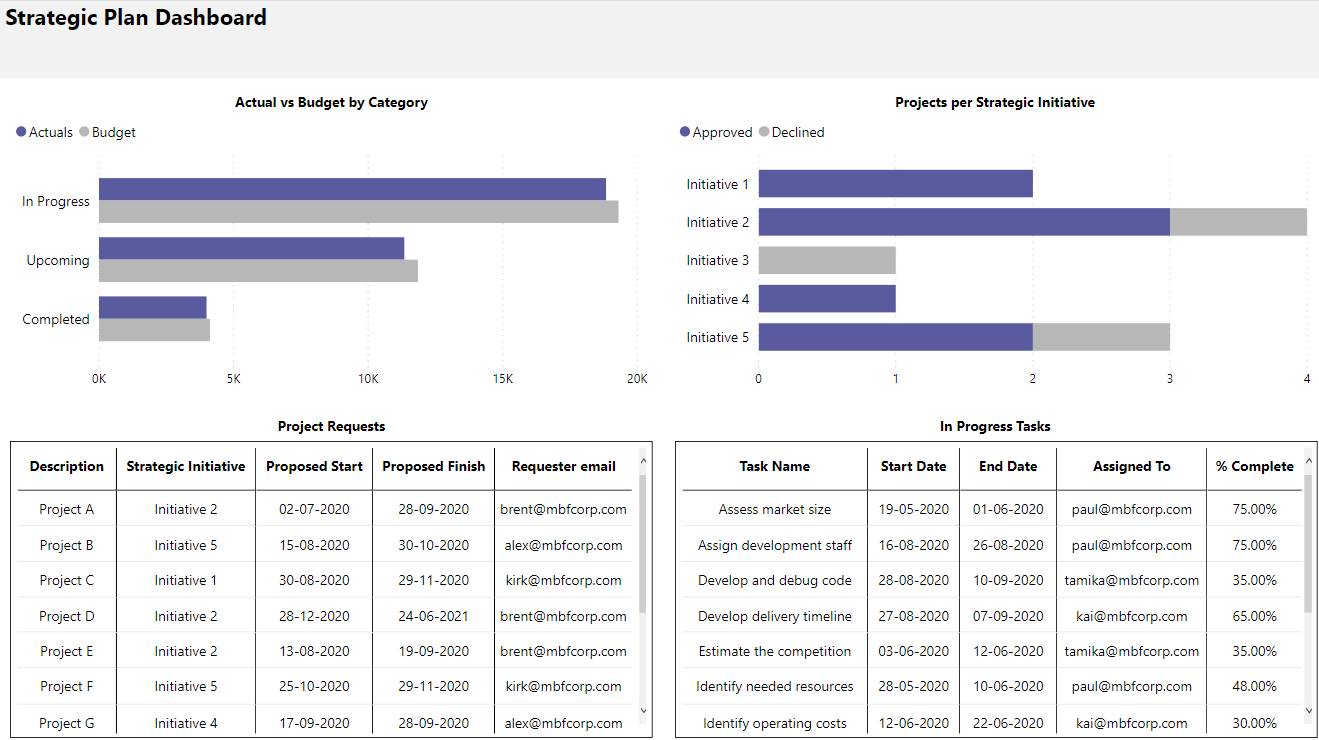
Strategic Plan Dashboard
Understanding your project pipeline from requests through delivery is enabled by this report.
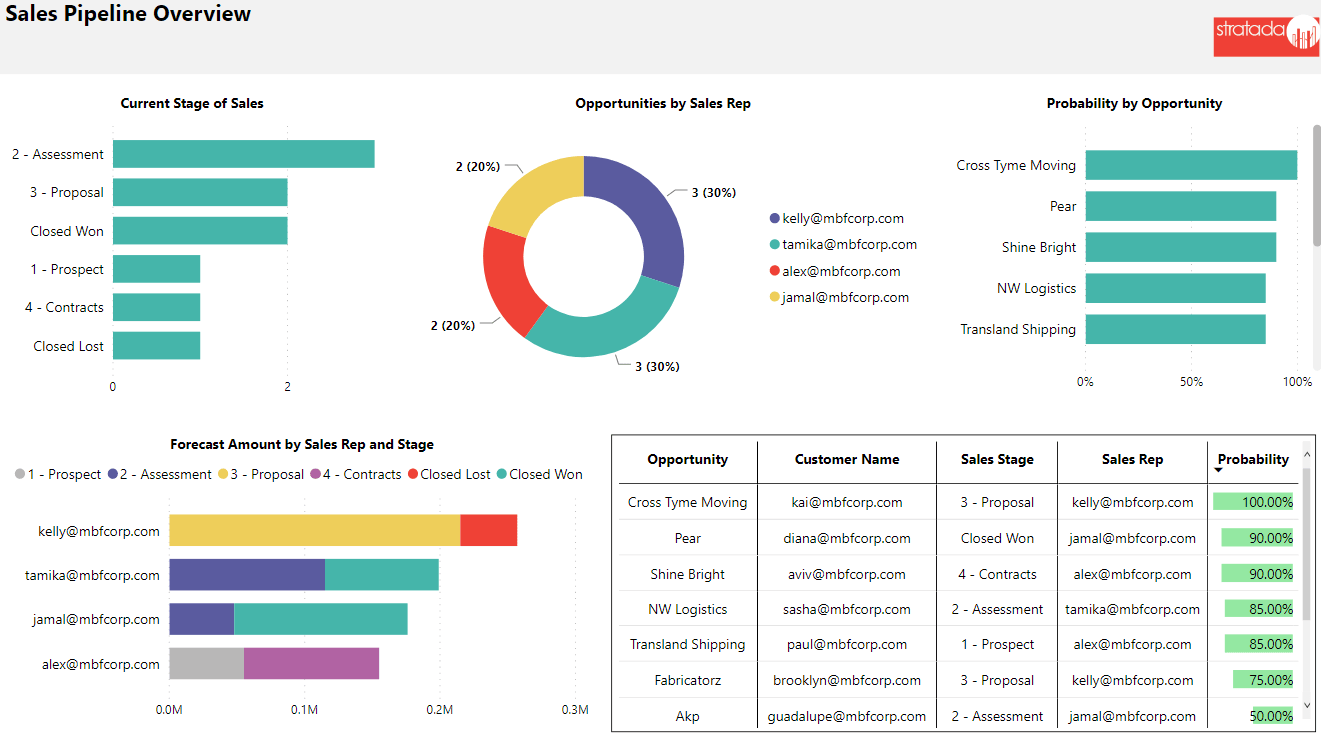
sales pipeline
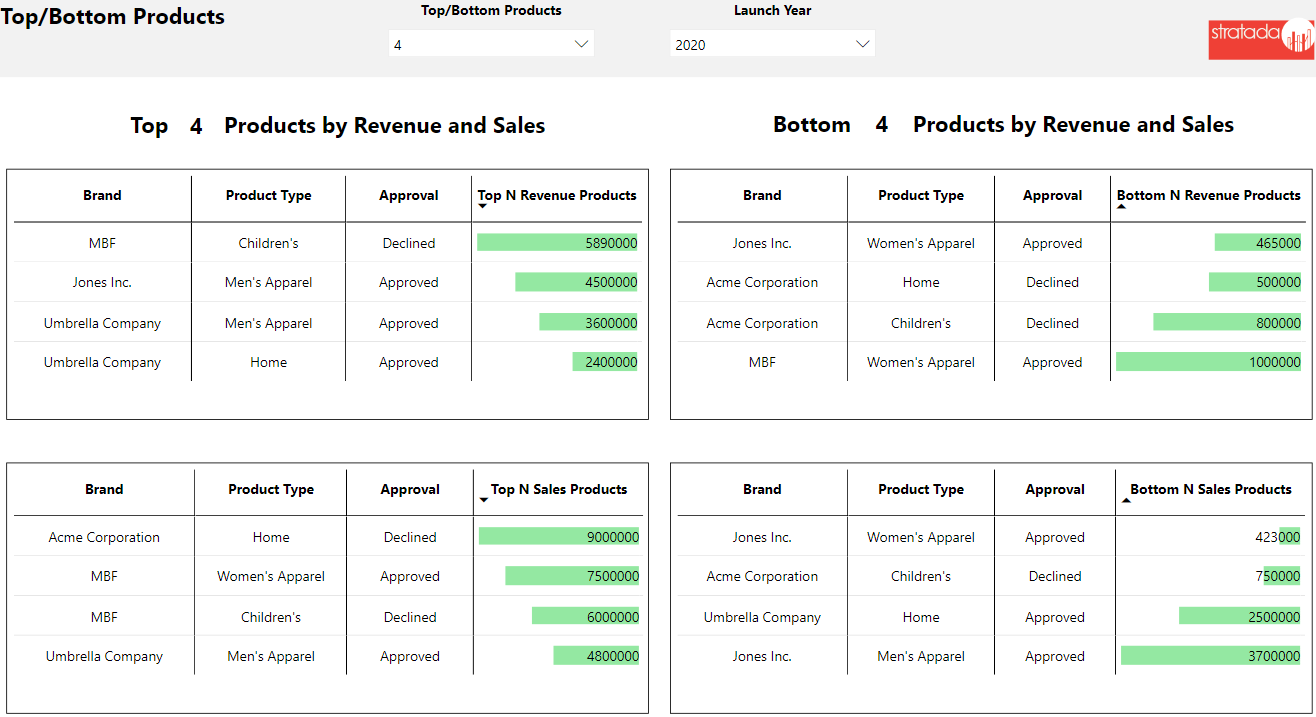
A sales pipeline is critical for many companies. This report provides an overview of opportunities and progress for sales deals.
project management dashboard
Smartsheet is often used for project management, and this dashboard utilizes the PowerGraph Gantt Timeline visual which is designed for that kind of data.
View Smartsheet live reports!
Developing reports and dashboards is both an art and a science. We put deep thought into our report packs so as to deliver a highly valuable product that is both insightful and elegant.