
Turn Complex Project Data into Executive Clarity on Power BI
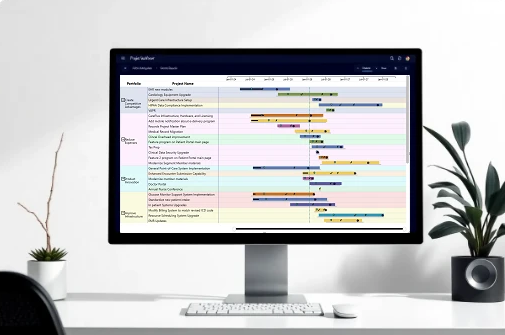
We design enterprise-grade PMO dashboards, data architectures, and custom Power Platform solutions. Visualized with the market's leading Gantt and Kanban controls.
EMPOWERING DATA WITH CUSTOM VISUALS AND APPS
Powering Success For






Seamlessly Integrated with






Why Standard Reporting Isn't Enough
Data Silos
Fragmented data across disparate systems hinders a unified view, making comprehensive analysis nearly impossible and leading to critical blind spots in decision-making.
Modeling Complexity
Building robust and scalable data models requires specialized expertise. Without it,complex data becomes unmanageable, leading to inaccurate insights and operational
inefficiencies.
Visualization Gaps
Static, unengaging reports fail to convey
insights effectively, leaving executives without the clarity needed to grasp project status and strategic implications at a glance.
Custom Power Apps & Automation
Automate the busy work and streamline your project workflows.
We develop tailored Power Apps and automation solutions that
connect your data, teams, and processes, freeing up valuable
time for strategic tasks and project execution.
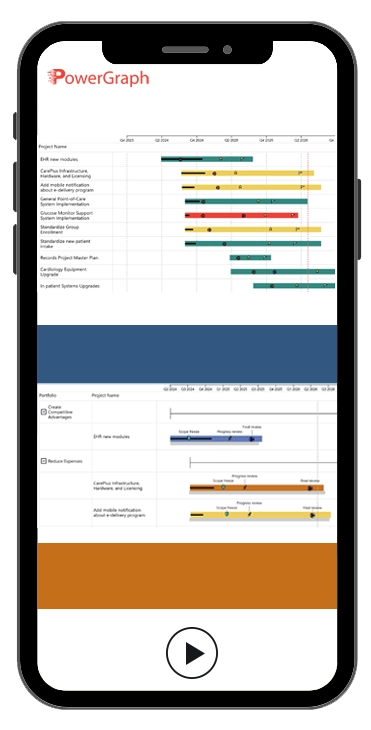
Powered by our Market-Leading Visual Suite
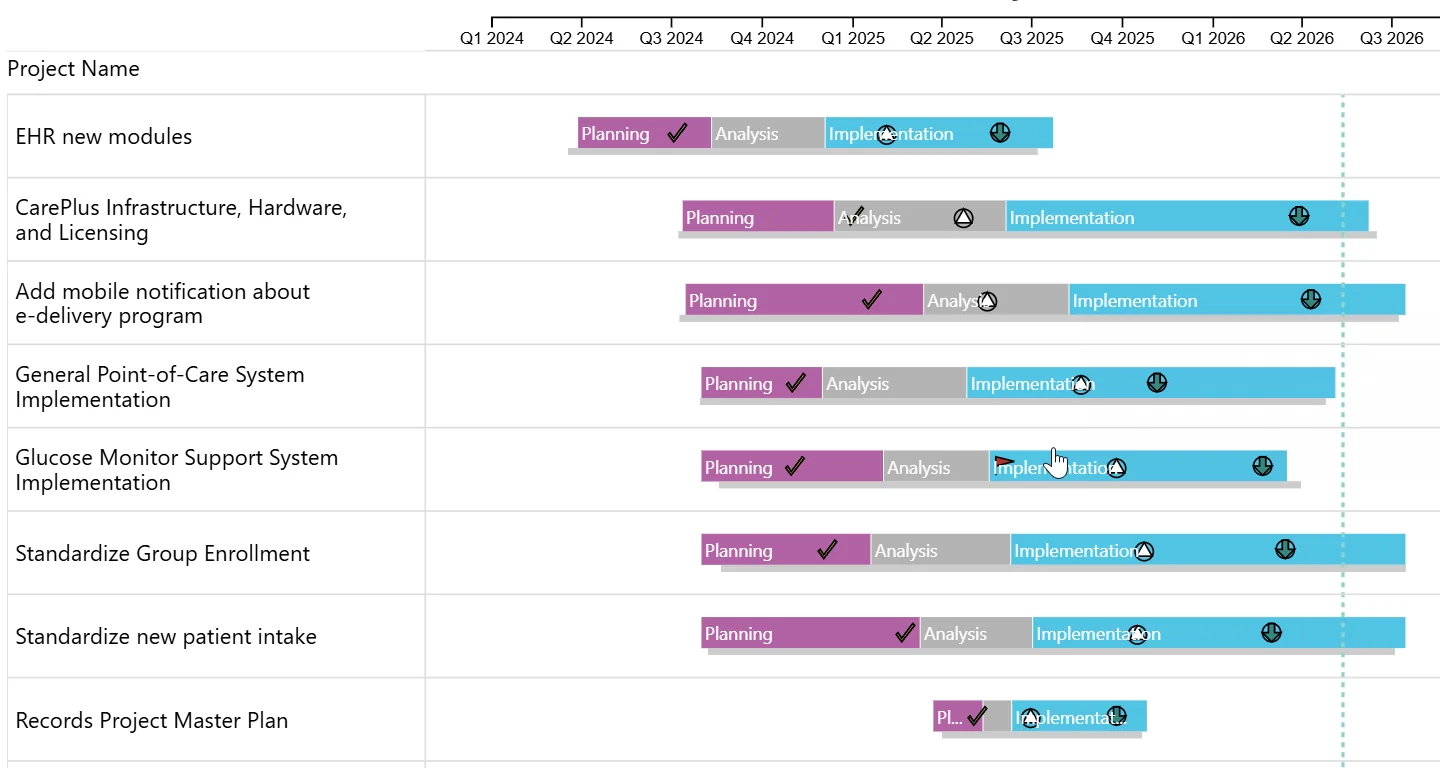
Gantt Timeline Visual
The #1 Gantt for Power BI. Visualize project schedules, track progress, and manage resources efficiently within your dashboards for complete project oversight.
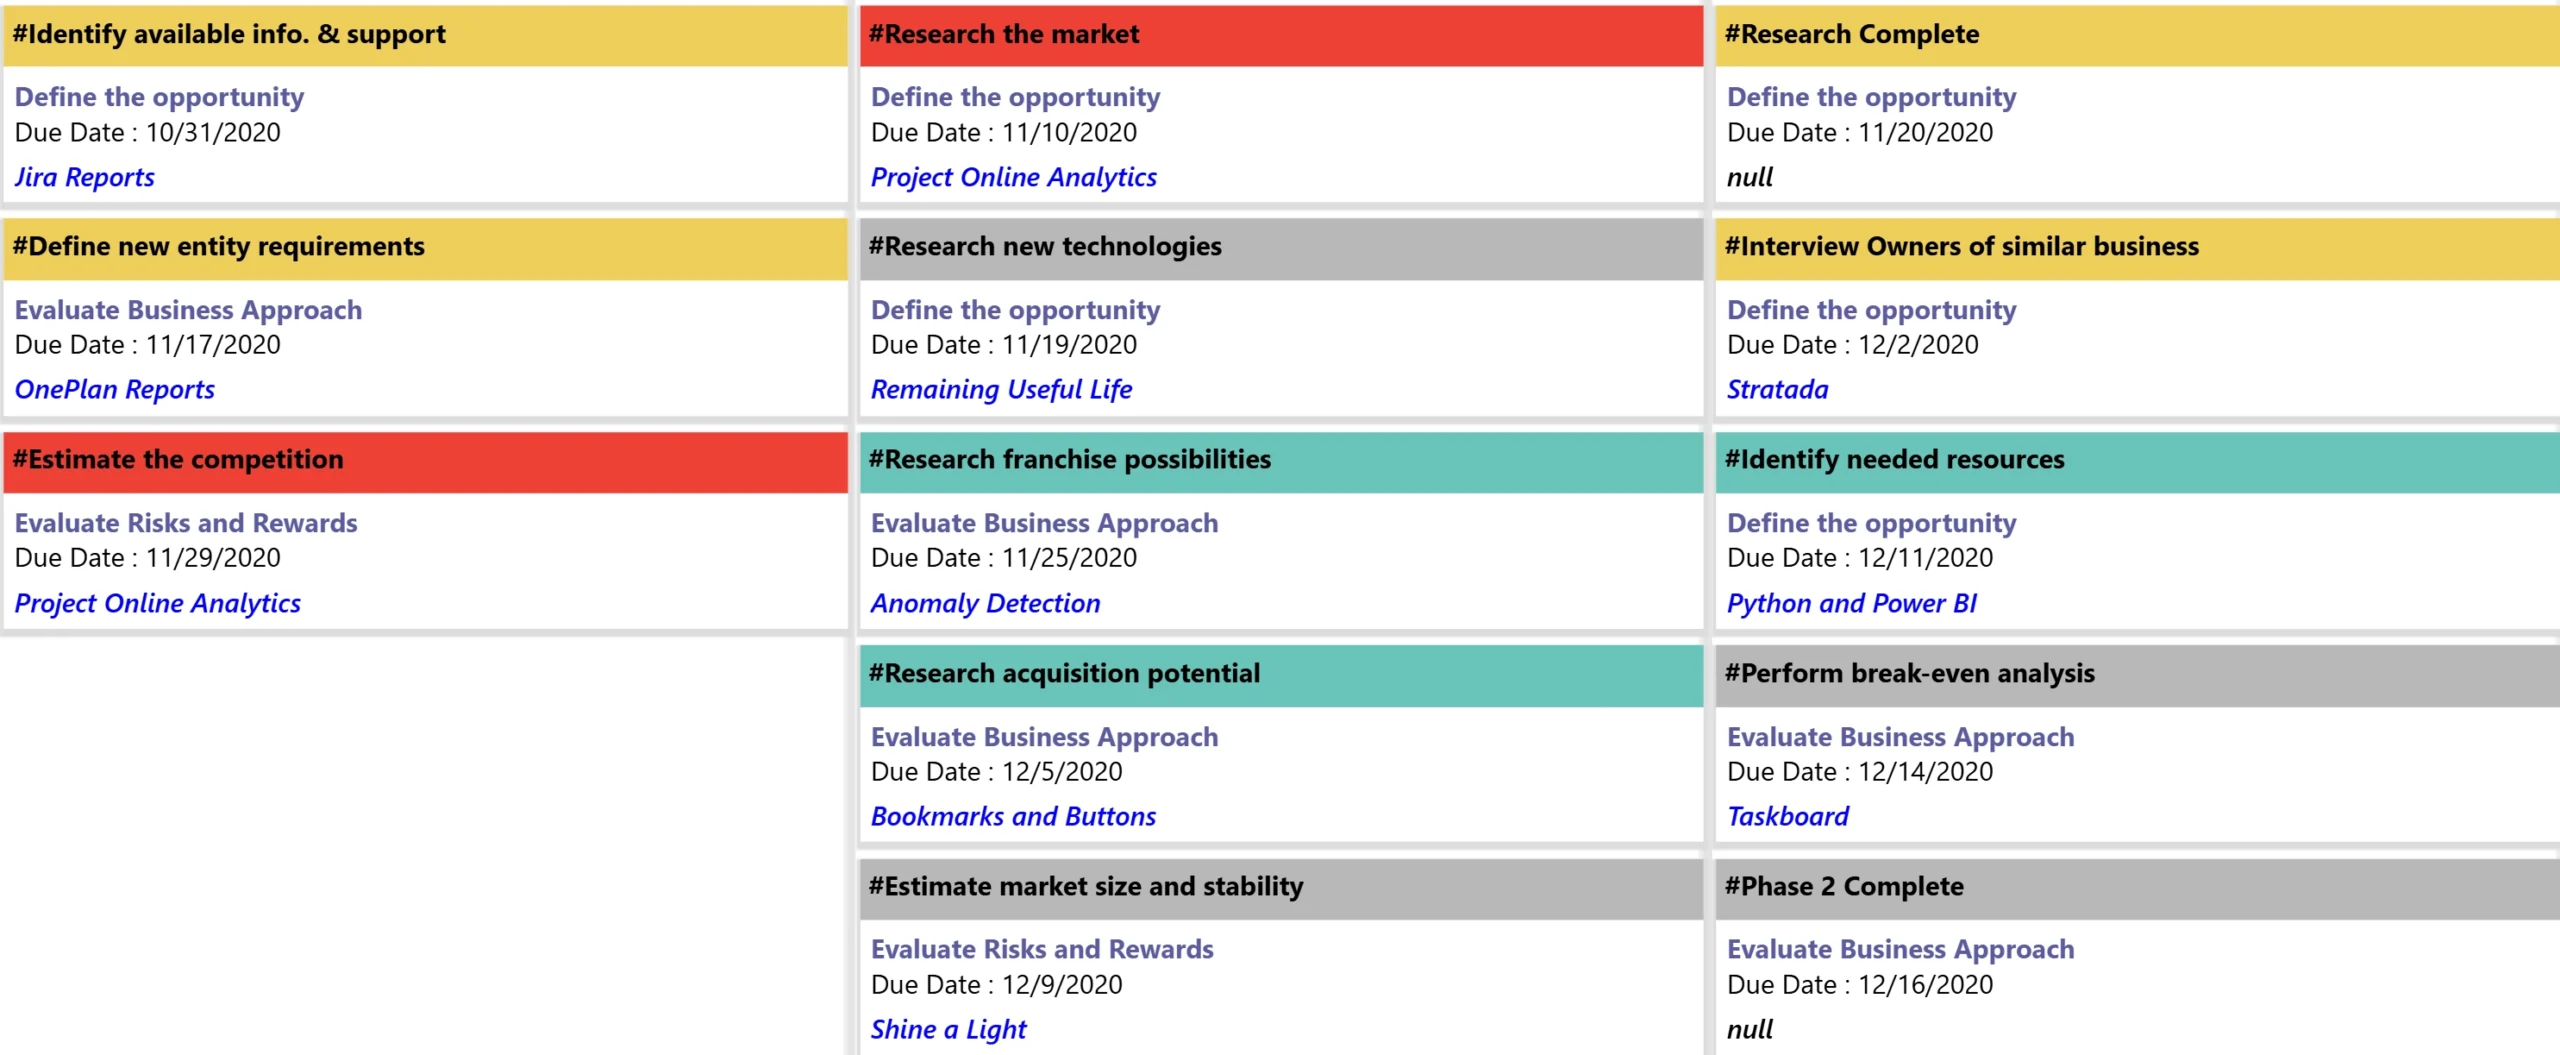
Kanban Task Board Visual
Agile tracking within your dashboards. Organize tasks, manage workflows, and collaborate with your team using an intuitive Kanban board directly integrated into Power BI.
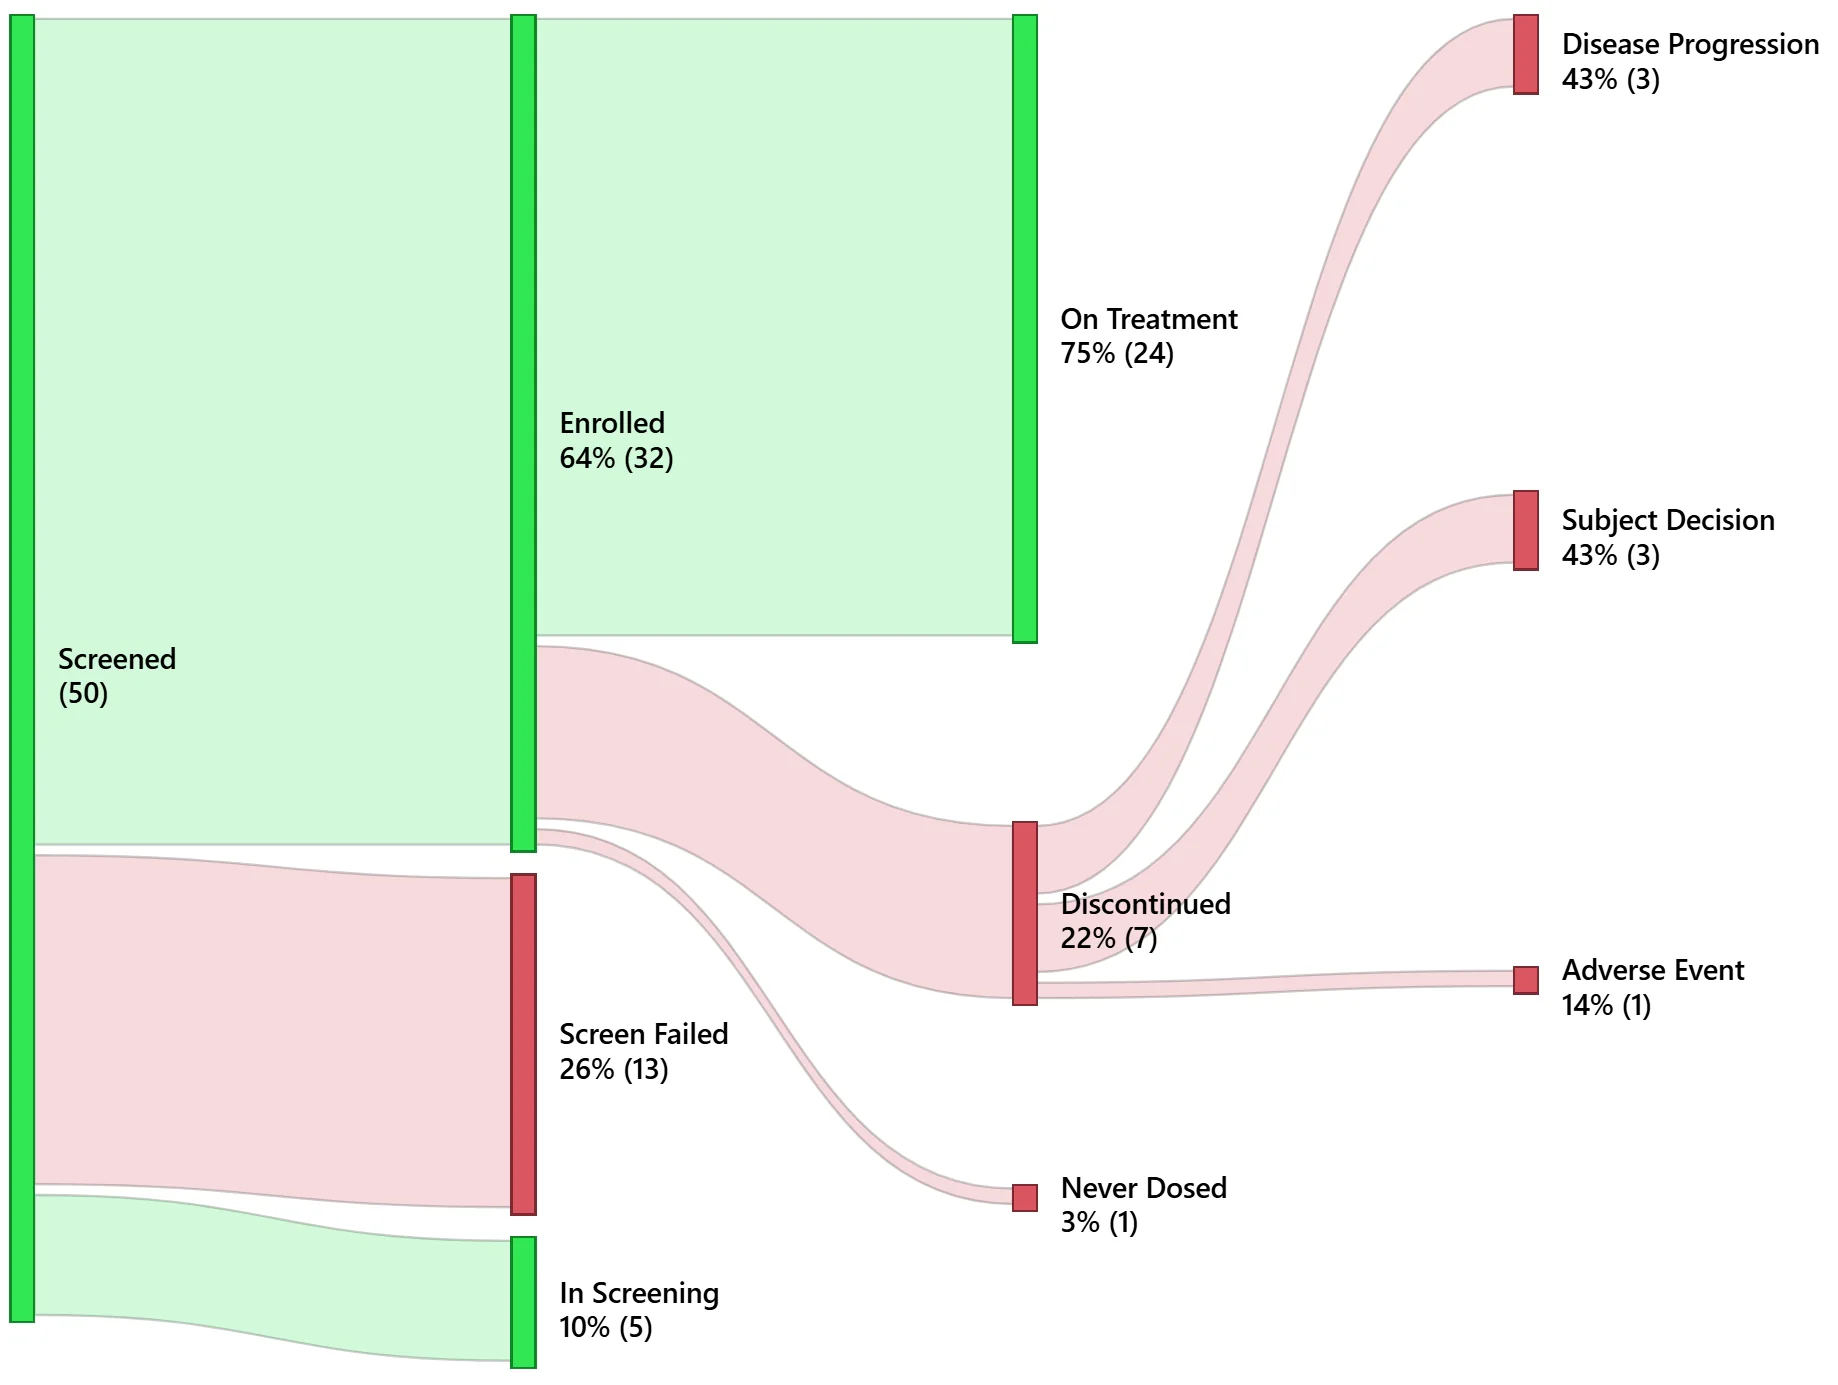
Sankey Visual
Process flow optimization. Visualize complex data flows and dependencies with beautiful Sankey diagrams, offering clear insights into process efficiency and resource allocation.
You can license our visuals directly from Microsoft Marketplace. Need help customizing them? That's where our team comes in.