
Microsoft Dynamics Project Operations Report Pack for Power BI
Microsoft Dynamics Project Operations is the right way to manage billable services engagements. Let our reports give you the insights you need to stay on time, deliver great quality and increase your profitability.
Features Overview
Timely insight of billable services project performance is important for making strategic decisions that could be the determinative factor as to whether or not a project succeeds based on customer satisfaction, profitability and more. Our Microsoft Project Operations reports help you stay on top of key performance indicators, analyze project progress, drill into financial and resource details, and much more.
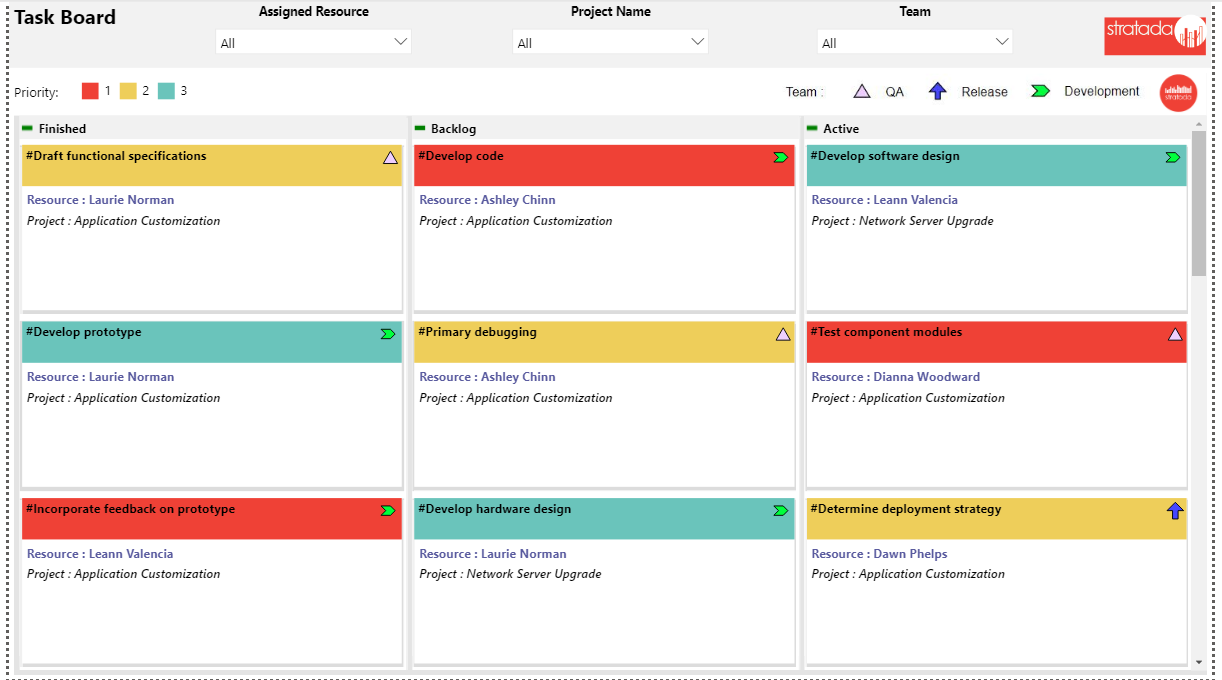
Task Board
See tasks in a Task Board layout from one or multiple projects. Color the card header by category, use icons to show another categorization on each card, and add up to three text fields in the card body. Drag-and-drop to change the bucket order.
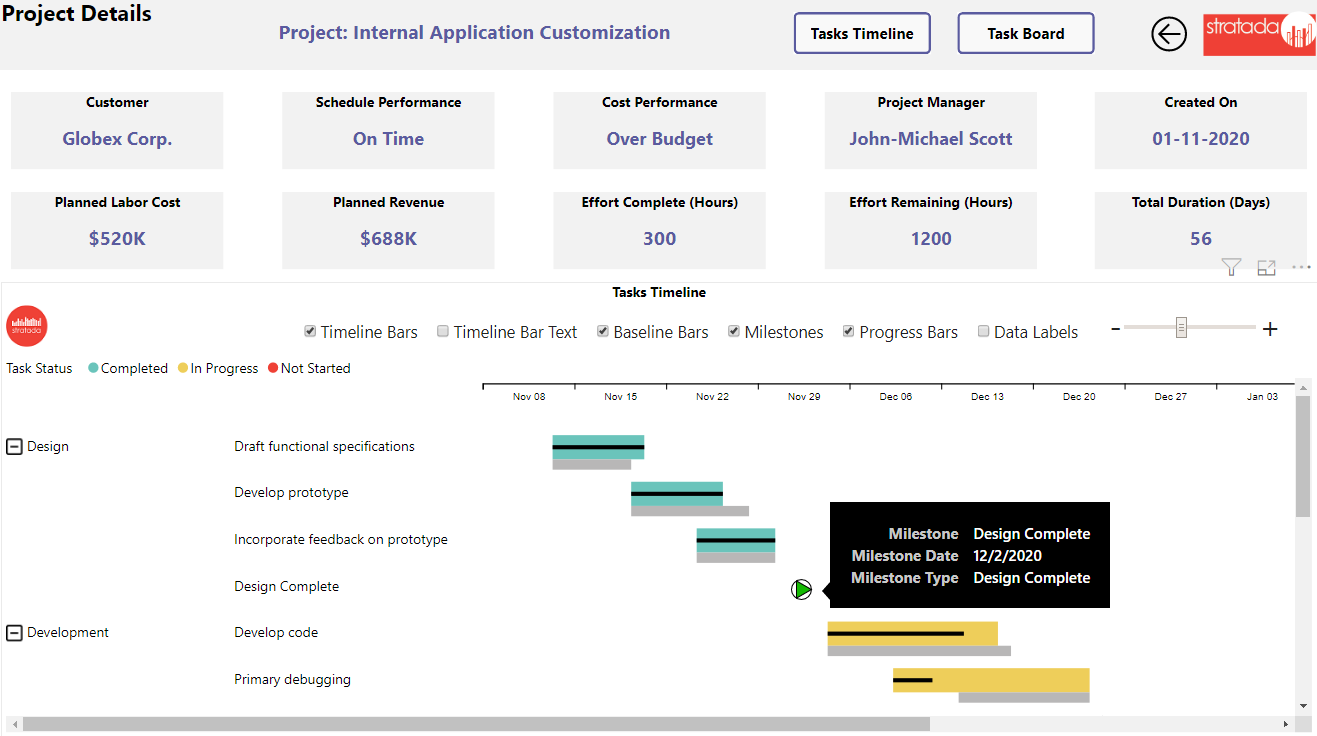
Project Details
See project details like schedule, cost, revenue and more. The PowerGraph Gantt Timeline custom visual can display timeline bars, milestones and even baseline bars.
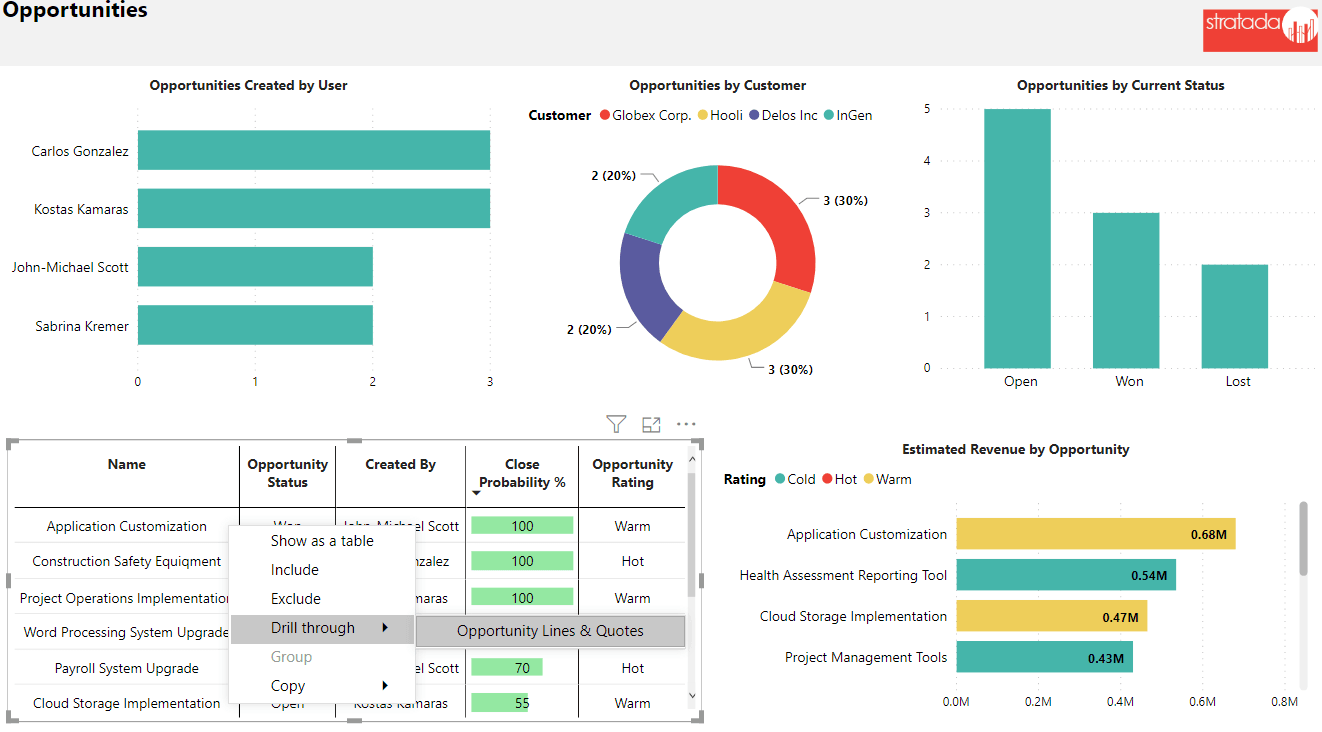
Opportunities
The opportunities report displays metrics on revenue, customer, status, rating and more. Use Drill-through to see additional detail on Opportunity Lines & Quotes
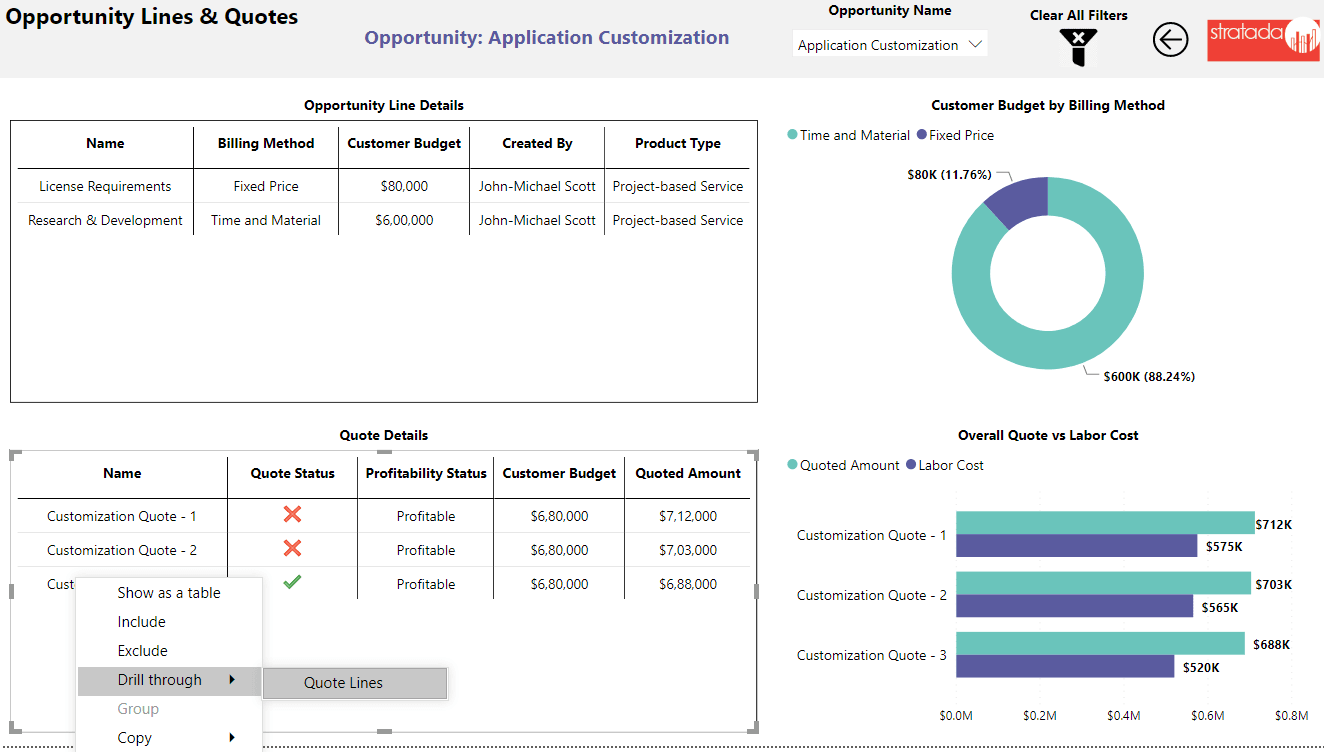
Opportunity Lines and Quotes
Analyze more details around billing method, customer budget, profitability and other metrics with the Opportunity Lines and Quotes report. Then drill down for more details on Quote lines.
Quote Lines
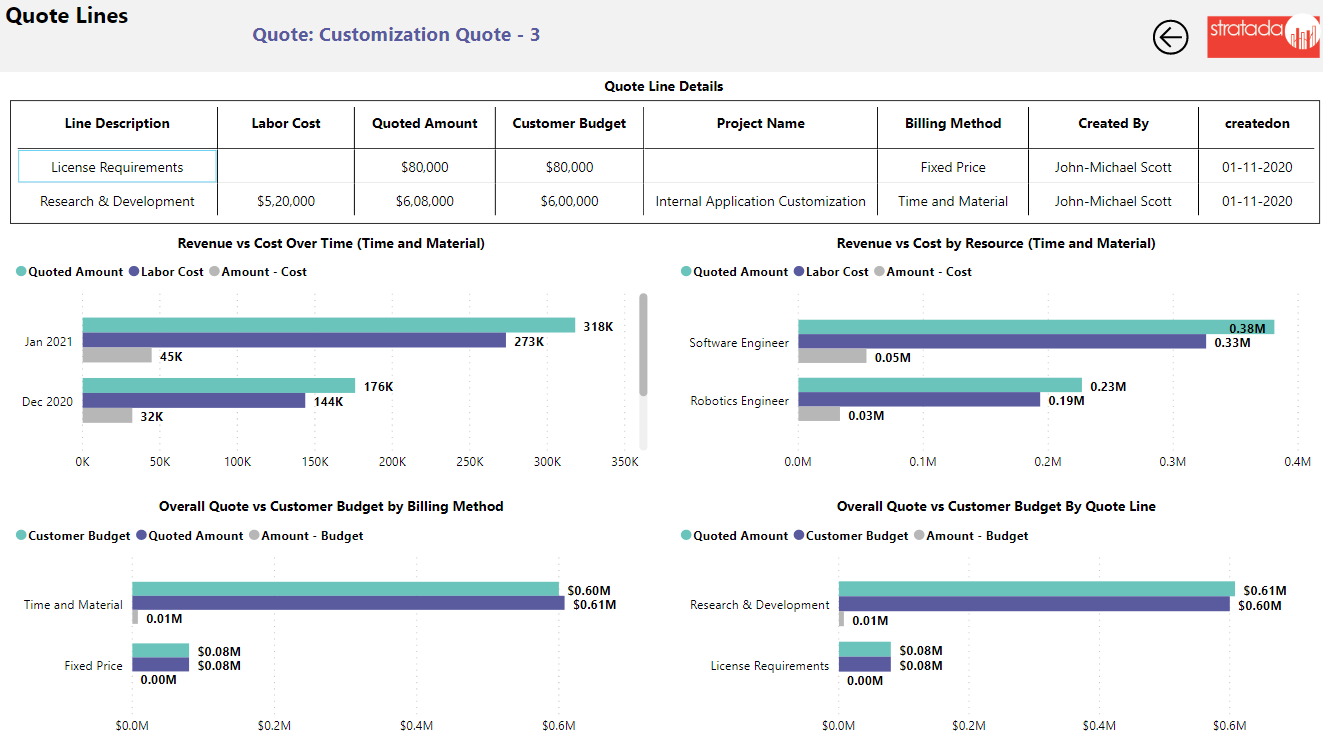
Quote lines details shows important details around labor cost, quoted amount, customer budget, etc. Next, compare critical business factors like revenue vs cost or quote vs budget.
View Project Operations live reports!
Developing reports and dashboards is both an art and a science. We put deep thought into our report packs so as to deliver a highly valuable product that is both insightful and elegant.