
The fields that are used to configure the PowerGraph Gantt Timeline
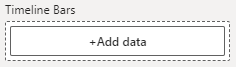
Use a data field that contains the names of the entities that will be represented by the Gantt Timeline bars. For example, this could be a list of projects or tasks
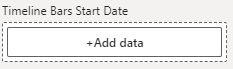
Use a data field that defines the start date of the Gantt Timeline bars
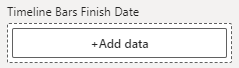
Use a data field that defines the finish date of the Gantt Timeline bars
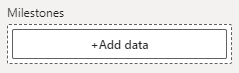
Use a data field that contains the names of the entities that will be represented by the Gantt Timeline Milestone shapes.
Use a data field that defines the date of the Gantt Timeline milestones
Use a data field that defines the categorization of the Gantt Timeline bars, milestones, or both. In previous versions of this visual, this field was named Timeline Category.
Use a logical TRUE/FALSE data field that identifies whether a record represents a Milestone or a Gantt Timeline Bar. The data should show TRUE if the record is a Milestone. This field is sometimes required for a visual that contains both Gantt Timeline Bars and Milestones, and a legend field is present.
Add one or more fields that define a hierarchy of the data. For example, this might have Portfolio, Program and Project fields where the bars and milestones are displayed per project
Use a field that can be used to display text in the Gantt Timeline Bars
Use a field that can be used to display text labels for milestones and/or Gantt Timeline Bars
Use a data field that defines the start date of the Gantt Timeline Baseline bars
Use a data field that defines the finish date of the Gantt Timeline Baseline bars
Use a data field that drives the percent completion bar
Use a data field that can be used to sort the Gantt Timeline bars and/or milestones
Use one or more data fields that will be displayed in the Gantt Timeline Bar tooltips
Use one or more data fields that will be displayed in the Milestone tooltips